Australian Business Sales Insights - June Quarter 2026

Australian Business Sales Market on Bsale - June Quarter 2026
Australia's business for sale market on Bsale is not short of buyer interest, but the June quarter shows buyers are becoming harder to convert.
Buyer enquiries rose about 13% on the March quarter, the second consecutive quarterly increase, while the number of businesses for sale on Bsale grew 2.0%. The national average asking price held broadly steady at $696,475, down 0.9% from $703,133 in March.
A total of 417 businesses were marked as sold during the quarter, with an average advertised asking price of $547,818. These are asking prices displayed when listings were marked as sold, not confirmed sale prices.
The message is that buyers are in the market but taking longer to commit. More enquiry is not automatically translating into more businesses marked as sold, with buyers comparing more opportunities, scrutinising financials and placing greater weight on pricing, business quality and operational risk.
The timing of the Federal Budget, announced on Tuesday 12 May 2026, may have added to this more cautious environment. Falling mid-quarter and ahead of 30 June, the Budget coincided with a period when many business owners were already reviewing their tax position, performance, succession planning and exit timing. While it is difficult to measure the Budget's direct impact, uncertainty around tax settings and business costs likely added another layer of consideration for both sellers and buyers.
Rather than pointing to a weak market, the June quarter reflects a more discerning one. Listings grew, buyer enquiry strengthened and businesses continued to be marked as sold.
For sellers, this is an important signal. The market remains open, but it is less forgiving. Businesses with clean financials, realistic pricing, recurring revenue, manageable operations and clear performance are better positioned to turn enquiry into serious buyer engagement. For buyers, the quarter suggests more choice and potentially greater negotiating power, particularly where sellers are motivated and pricing expectations have not yet adjusted to market conditions.
Note: The figures in this report should be used as a general guide to trends only. The data has inherent limitations, outlined in About This Data at the end of this article. This information should not be relied on when making legal, financial or investment decisions.
National Overview
The June 2026 quarter showed a stable national picture on Bsale, with listings growing and asking prices holding broadly steady.
The number of businesses for sale on Bsale rose 2.0% over the quarter and 6.7% since September 2025. The increase came around the end of the financial year, when many owners reassess performance and exit timing.
The national average asking price eased slightly, from $703,133 in March to $696,475 in June, down 0.9%. Over the past four quarters, the average has moved within a relatively narrow range, from $664,233 in September 2025 to a peak of $703,133 in March 2026. That suggests the mix of businesses coming to market has been broadly consistent rather than shifting sharply toward higher- or lower-value listings.
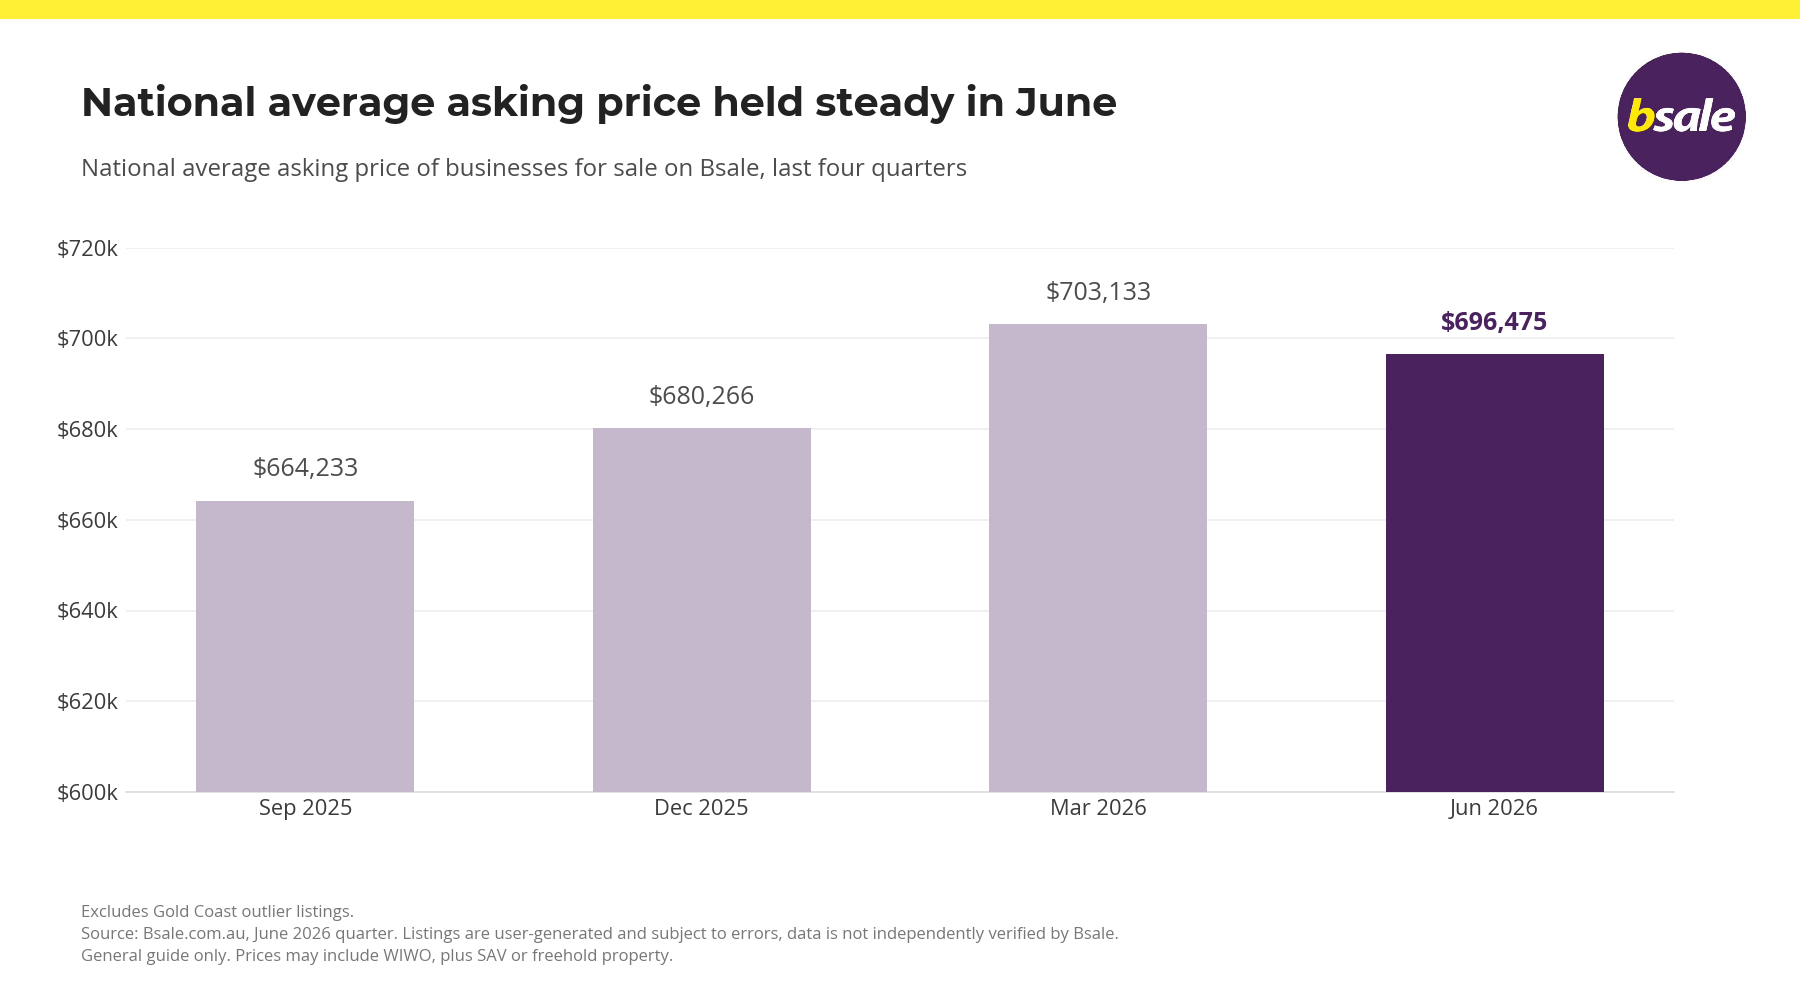
Graph: Businesses for sale on Bsale, indexed (September 2025 = 100), September 2025 – June 2026.
Overall, the June quarter reflects a steady market on Bsale. More businesses are coming to market, but buyers are taking longer to commit.
State Analysis
Western Australia and Queensland recorded the highest average asking prices in June 2026, while Tasmania was the most affordable state. Most of the larger states moved by less than 3% over the quarter, with South Australia the clear exception.
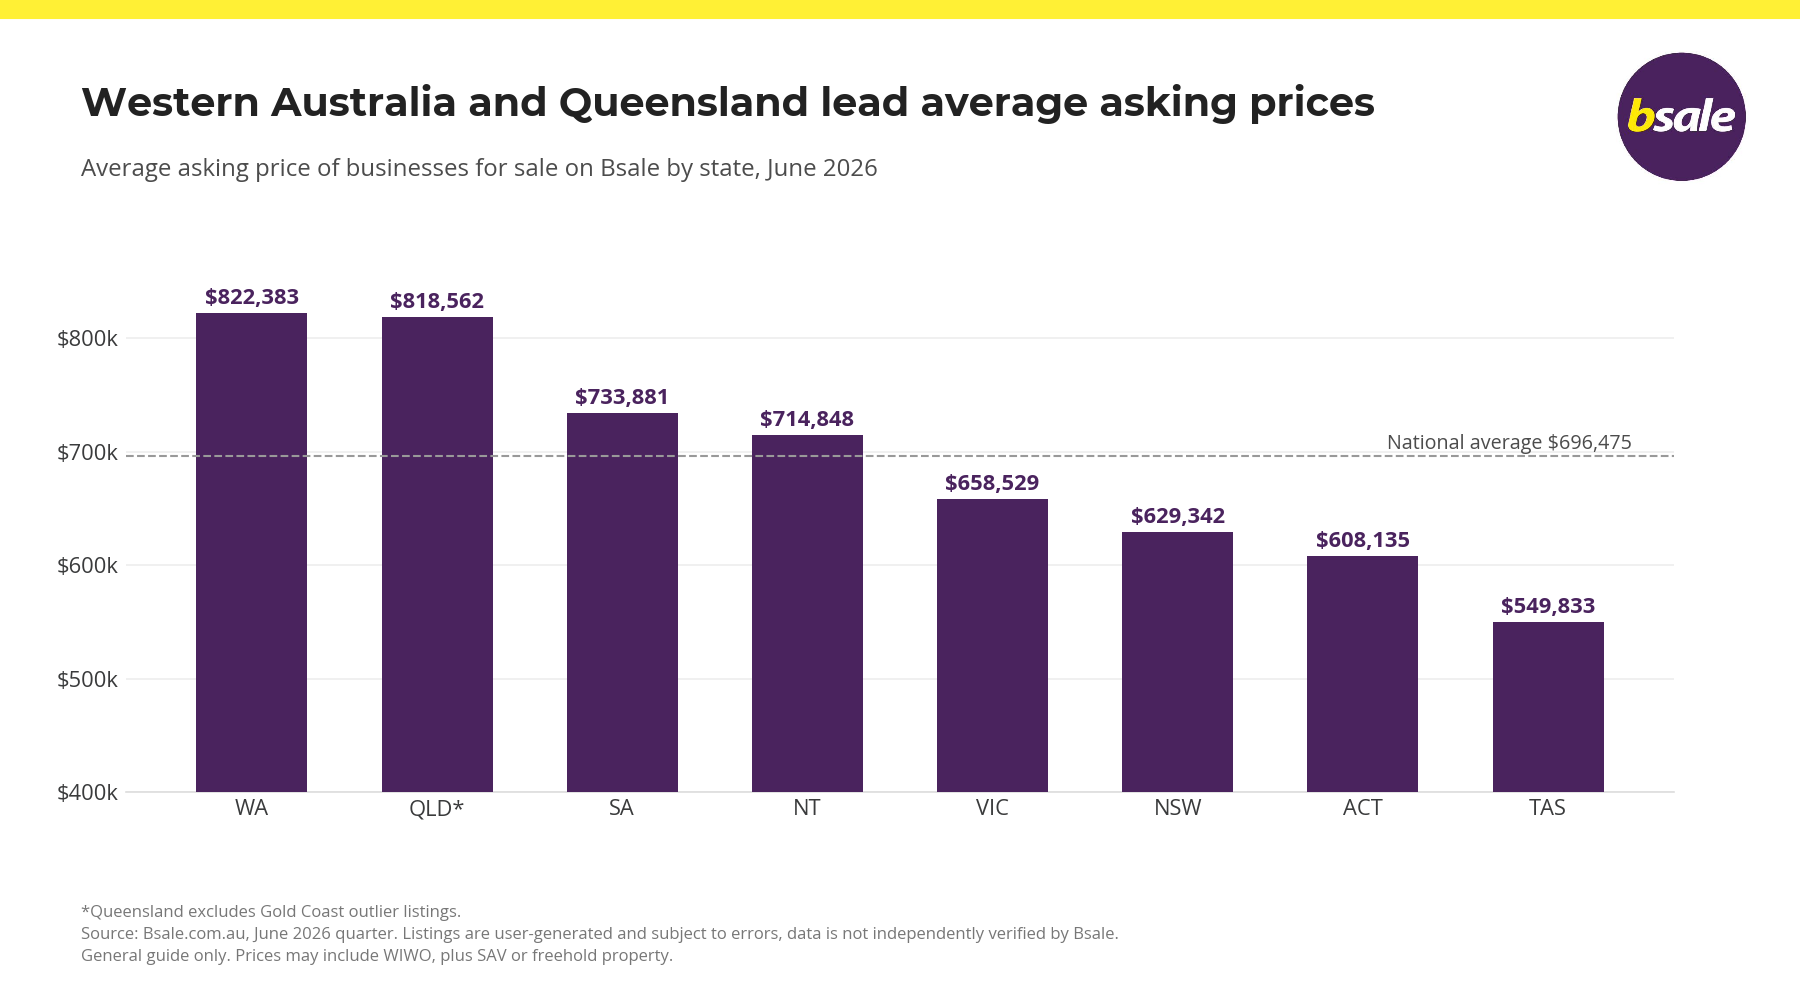
Graph: Average asking price of businesses for sale on Bsale by state, June 2026.
Western Australia
Western Australia narrowly held the highest average asking price of any state at $822,383, easing 0.8% from March. The number of businesses for sale in WA fell 5.7% over the quarter.
WA's pricing continues to be supported by larger, asset-backed and resource-linked businesses. Transport, industrial services, regional operations and businesses connected to mining and essential industries continue to influence the state's pricing profile.
Queensland
Queensland followed closely at $818,562, down 0.8% from March, with listings up 2.6%. This figure excludes Gold Coast outlier listings.
The state continues to perform strongly across Brisbane, the Sunshine Coast, Mackay and Central Queensland, Cairns and other regional markets supported by tourism, trades, resources, services and population growth.
South Australia
South Australia recorded the sharpest average price decline of the quarter, with the average asking price falling 23.9% from $964,180 in March to $733,881 in June. It still ranked third nationally.
The number of businesses for sale in SA rose 13.7% over the same period. Rather than a broad weakening, the result appears to reflect a shift in listing composition. March was influenced by a concentration of higher-value listings, while more smaller and mid-market businesses entered the market in June.
Northern Territory
The Northern Territory averaged $714,848, up 2.3% from March. As a small market, a handful of higher-value listings can materially shift the average, so quarterly movements should be read with care.
Victoria
Victoria recorded another stable quarter, with the average asking price rising 2.7% to $658,529 and listings up 6.5%.
Victoria's large listing pool helps moderate major swings in average price. Melbourne and regional Victorian markets continue to offer a broad mix of hospitality, retail, services, health, trades, manufacturing and franchise opportunities.
New South Wales
New South Wales remained Australia's largest business for sale market on Bsale by listing volume. Its average asking price was broadly unchanged at $629,342, while listings rose 4.7%.
With the deepest pool of listings, NSW is less exposed to sharp swings caused by individual high-value listings. Its market continues to be shaped by a broad mix of cafes, service businesses, retail operations, professional services, industrial businesses and regional opportunities.
Australian Capital Territory
The ACT averaged $608,135, down 5.9% from March, making it the second most affordable state or territory. As a relatively small market, its average can move noticeably with a few listings.
Tasmania
Tasmania recorded the lowest average asking price of any state at $549,833, up 5.2% on March, while listings eased 5.4%.
As a smaller market, Tasmania's average can be influenced by a relatively small number of higher-value listings, particularly in tourism, hospitality, accommodation and freehold-related opportunities.
Regional Market Insights
Regional Australia again recorded the highest average asking prices on Bsale, led among the larger markets by Mackay & Central Queensland at $1.77 million.
Many of the country's highest-priced markets sit outside the capital cities, particularly in regions supported by mining, transport, tourism, agriculture, freehold ownership and asset-heavy industries.
The highest-priced regional markets
Mackay & Central Queensland recorded the highest average asking price of any larger regional market, reflecting the strength of mining, industrial, transport and essential service businesses across the region.
Gippsland followed at $1.36 million, up 6.7% on March, while Shepparton & Hume rose 28.9% to $940,302. The Mid North Coast NSW ($901,667) and the South Coast NSW ($825,750) rounded out the five highest-priced larger regional markets.
Several smaller markets recorded higher averages, including Broome & Kimberley ($2.36 million), Alice Springs ($1.50 million), Broken Hill & Western NSW ($1.37 million) and the Pilbara ($1.36 million). Each has fewer than 25 listings, so one high-value business can move the average sharply.
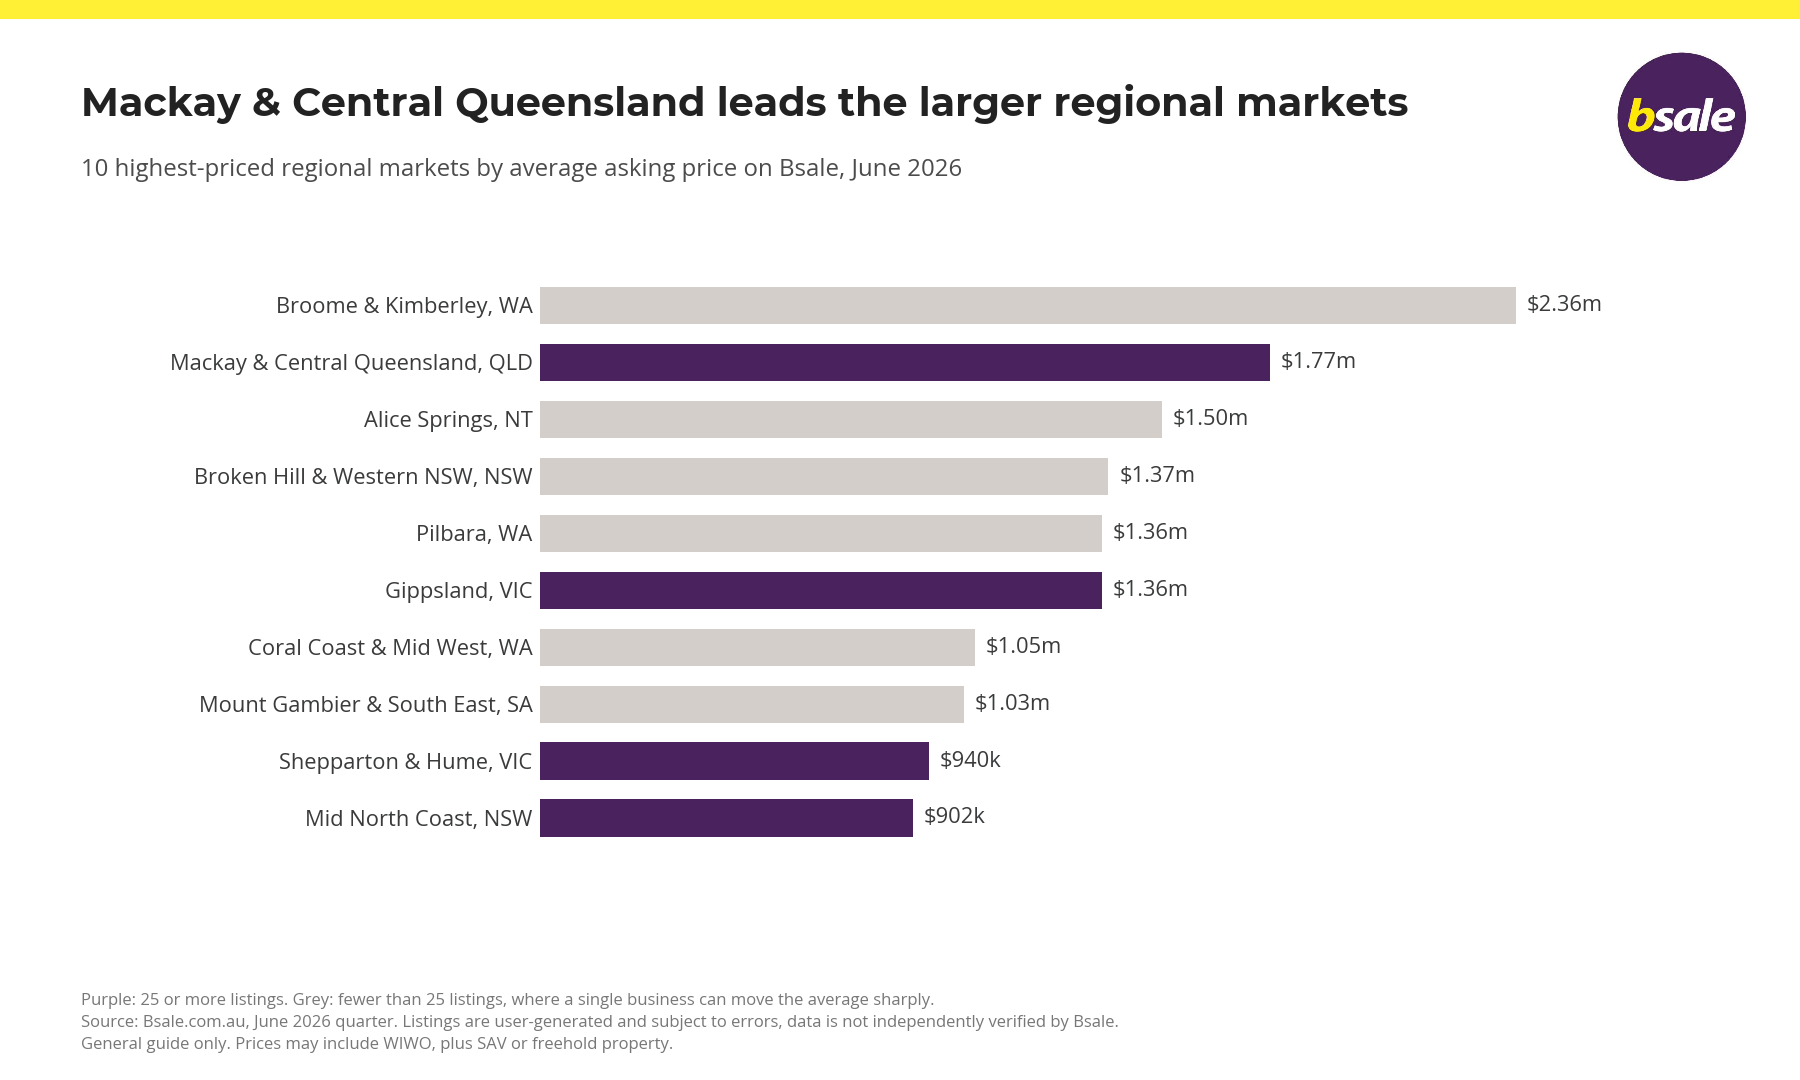
Graph: 10 highest-priced regional markets by average asking price on Bsale, June 2026.
These results show the continued strength of regional markets where businesses are often larger, asset-backed, freehold-related or connected to essential regional industries.
The mid-range
The larger coastal and lifestyle markets sit in the middle of the market and offer buyers a wide choice. The Sunshine Coast averaged $737,910, Newcastle & Hunter Valley $696,929, Geelong & South West Victoria $695,114 and Cairns & Far North Queensland $686,216.
These markets remain popular with buyers seeking a combination of business ownership and lifestyle appeal. They also tend to contain a higher proportion of cafes, restaurants, tourism businesses, retail stores, health and wellness businesses, and service-based operations.
More accessible entry points
At the affordable end, the Blue Mountains ($300,614), Launceston & Northern Tasmania ($441,430), Bunbury & South West WA ($464,230) and the Mornington Peninsula ($466,309) recorded the lowest averages among the larger regional markets.
These markets may appeal to first-time buyers, owner-operators and lifestyle purchasers looking for businesses at lower entry points.
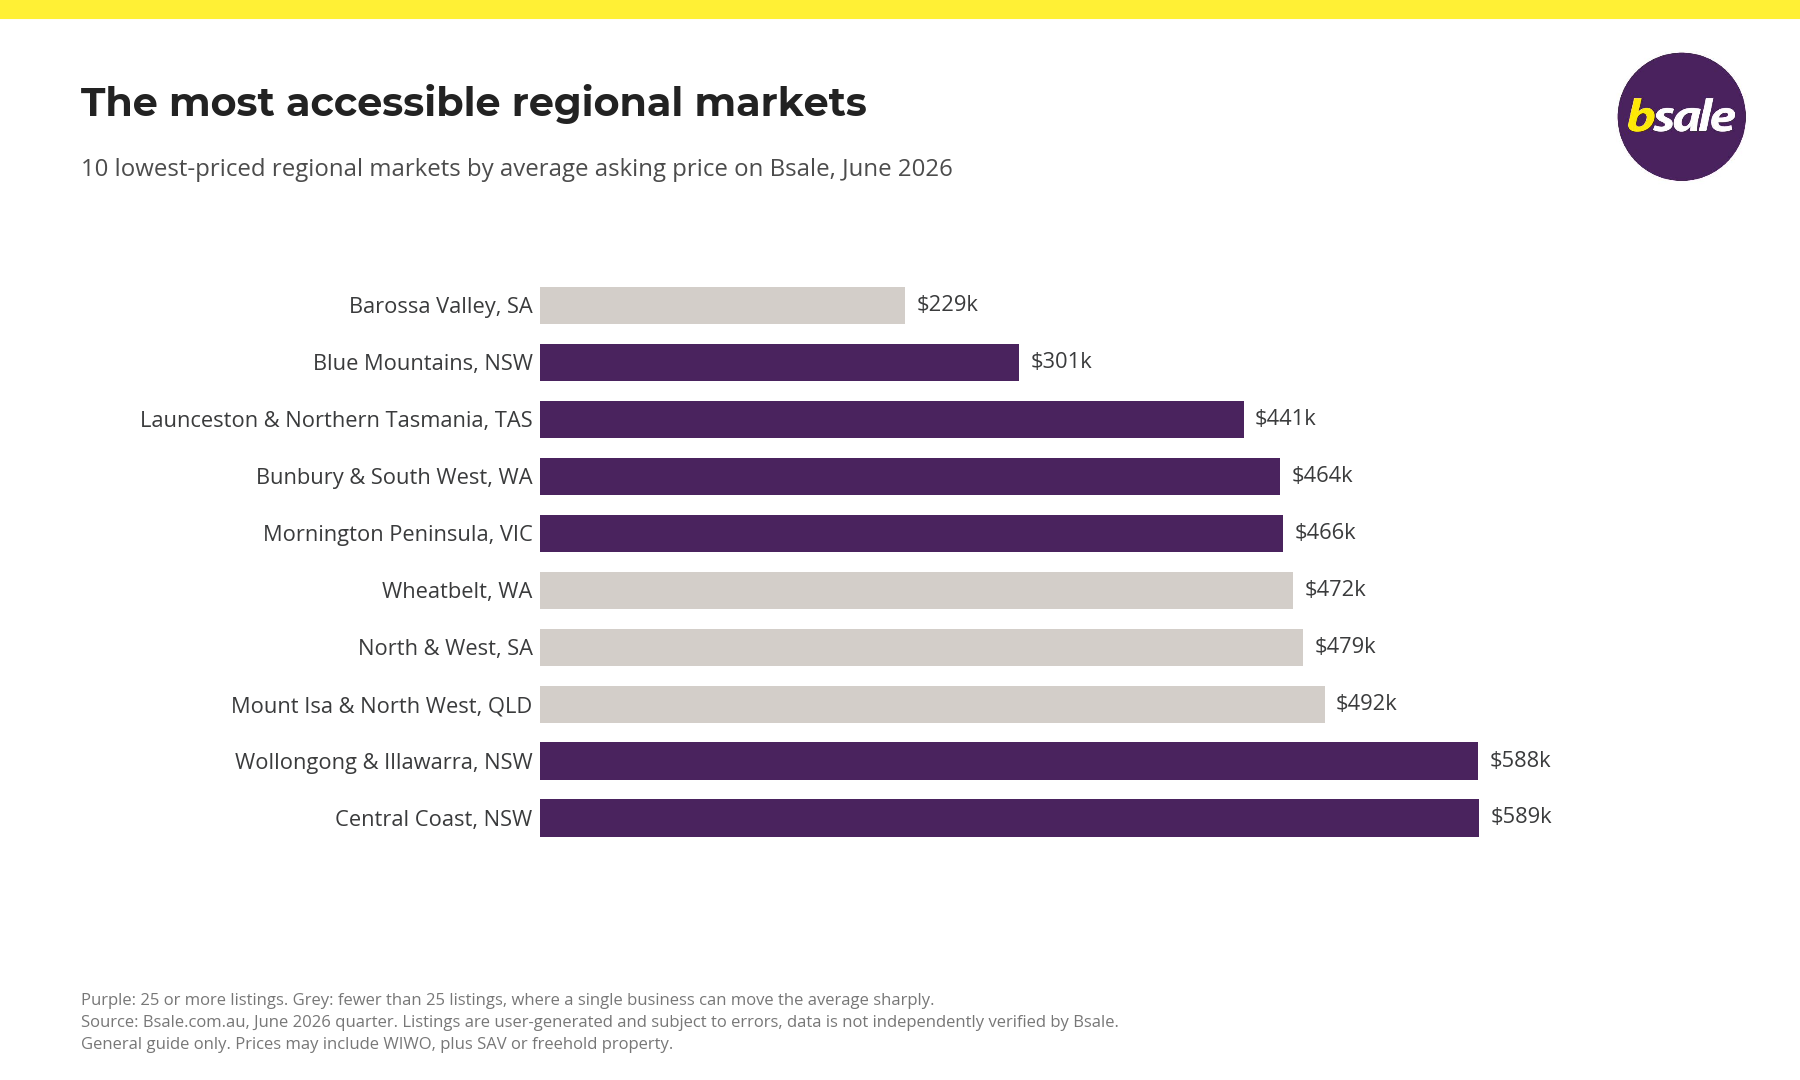
Graph: 10 lowest-priced regional markets by average asking price on Bsale, June 2026.
Higher regional averages may partly reflect what the asking price includes, such as plant, machinery, vehicles, stock or freehold property, so buyers should check what the price covers.
Capital City Analysis
Perth recorded the highest average asking price of the capital cities at $847,881, followed by Brisbane ($774,180) and Adelaide ($738,754).
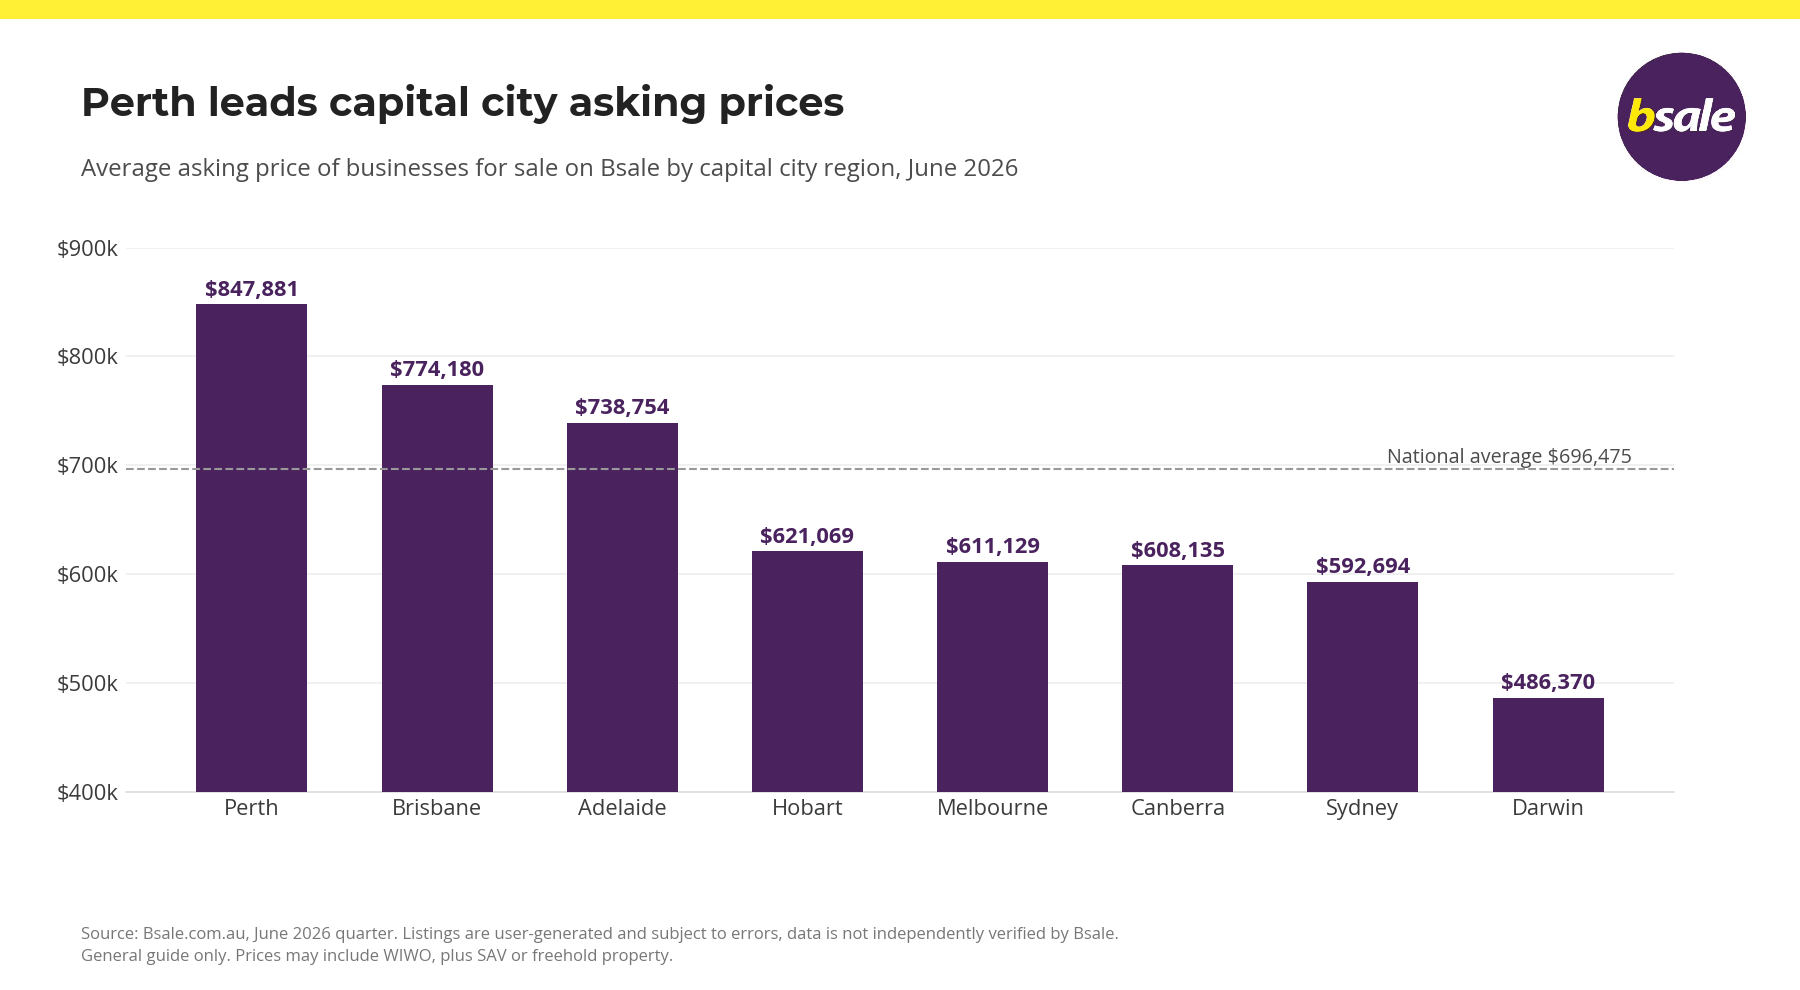
Graph: Average asking price of businesses for sale on Bsale by capital city region, June 2026.
Perth eased 1.4% from March but continued to benefit from WA's mix of asset-backed, industrial and resource-linked businesses. Brisbane eased 2.2%, while remaining one of Australia's most active business for sale markets.
Adelaide recorded the largest capital city fall, down 27.7% from $1.02 million in March. This mirrors the broader South Australian result and appears largely driven by a change in listing composition after a stronger March quarter.
Hobart rose 11.2% to $621,069. As one of the smaller capital city markets, its average can be influenced by a limited number of higher-value tourism, accommodation or freehold-related opportunities.
Melbourne ($611,129) was virtually unchanged, while Sydney edged up 1.6% to $592,694. As the two largest capital city markets on Bsale, they include many smaller cafes, restaurants, retail and service businesses, which keeps their averages lower while giving buyers the widest choice of any market.
Canberra averaged $608,135, down 5.9%, and Darwin $486,370, the lowest of the capitals. Both are smaller markets, where averages can shift noticeably with just a few listings.
Overall, the capital city data shows a stable market, with the largest price movements driven by listing mix rather than major shifts in buyer demand.
Where Buyers Are Enquiring
Buyer enquiry behaviour during the June quarter points to a practical and selective market. Buyers are active, but they are not enquiring randomly. They are gravitating toward businesses with clear earnings potential, simple operations, recurring demand and realistic pricing.
Compared with the March quarter, overall email enquiry activity increased by approximately 13%, indicating that buyer engagement strengthened through the second quarter. Rather than suggesting a speculative market, the data points to buyers actively reviewing opportunities across a broad range of sectors, with a clear preference for businesses that demonstrate cashflow, essential demand, simple operations or low owner involvement.
At a state level, New South Wales and Western Australia attracted the largest share of buyer enquiry activity. New South Wales accounted for approximately 32% of enquiries during the June quarter, increasing from around 28% in the March quarter. Western Australia remained very strong, attracting approximately 30% of enquiries, although this was down slightly from around 33% in Q1. Queensland followed with approximately 17%, while Victoria accounted for around 14%.
This shows that buyer interest remains concentrated in the major business markets, with continued strength in Western Australia. At a suburb level, enquiry activity was strongest around Perth, Sydney, Brisbane and Melbourne, with additional buyer interest spread across key suburban and regional locations including Mandurah, Coffs Harbour, Southport, Maroochydore, Newcastle, Joondalup, Bunbury and Port Macquarie.

Other Industries include business that have been loaded in multiple categories without clear titles, so enquiries arent clearly identified by industry.
From an industry perspective, hospitality, food and beverage remained the largest enquiry category, accounting for approximately 15.7% of Q4 enquiry activity. This was down from around 17.4% in Q1, suggesting hospitality remains highly active but buyer interest has become more selective. Cafes, restaurants, takeaway businesses, bars, bakeries and food service businesses continued to attract enquiries, particularly where listings promoted strong sales, low rent, simple operations, under-management structures or prominent locations.
Manufacturing, wholesale, industrial and trade businesses increased their share of enquiries, rising from approximately 12.8% in Q1 to 13.5% in Q4. This was one of the more positive shifts of the quarter and reflects continued buyer interest in businesses with established customer bases, repeat trade, supplier relationships and practical operating models. Listings involving distribution, importing, engineering, printing, building services, trade supply, equipment and industrial products continued to attract attention.
Retail and essential retail remained steady, accounting for approximately 11.5% of enquiry activity in Q4. Supermarkets, bottle shops, convenience stores, post offices, lotto agencies, general stores and product-based retail businesses continued to appeal to buyers seeking familiar business models and consistent customer demand.
Health, fitness, beauty and care businesses also remained strong, holding approximately 11.1% of enquiry activity. Gyms, Pilates studios, wellness businesses, NDIS-related businesses, allied health, beauty and personal care businesses all continued to feature. This reflects ongoing buyer interest in businesses supported by memberships, appointments, recurring clients or growing consumer demand for health and lifestyle services.
Automotive, fuel and vehicle service businesses accounted for approximately 7.9% of enquiry activity, easing slightly from Q1 but remaining an important buyer category. Service stations, car washes, mechanical workshops, tyre businesses, vehicle hire businesses and automotive service operations continued to attract enquiries, particularly where they were positioned as established, branded or semi-managed opportunities.
One of the clearest buyer themes during the quarter was interest in businesses offering simplicity and low owner involvement. Cleaning, home and property service businesses increased their share of enquiries to approximately 6.1%, while laundry, vending and automated service businesses remained steady at around 2.5%. Fully automated car washes, laundromats, vending businesses, cleaning operations and property services all attracted interest, reflecting buyer demand for practical businesses with clear systems and manageable operating requirements.
Online, technology and digital businesses continued to attract attention, accounting for approximately 5.7% of enquiries. AI businesses, digital agencies, ecommerce stores, software applications and remote service businesses remained a smaller but important part of enquiry activity. These opportunities appeal to buyers looking for scalability, flexibility and lower overheads, although the category remains more niche compared with hospitality, retail and industrial businesses.
Accommodation, tourism and leisure businesses remained stable at approximately 4.8% of enquiry activity. Roadhouses, pubs, motels, accommodation businesses and tourism-related opportunities continued to receive interest, particularly where listings included strong regional positioning or asset-backed appeal.
Franchise and licence opportunities also increased slightly, rising from approximately 1.4% in Q1 to 2.0% in Q4. This suggests some buyers are continuing to look for structured entry points into business ownership, particularly where the model provides brand recognition, systems and support.
Overall, the June quarter reinforces a clear message that buyers are active, but disciplined. The strongest enquiry themes continue to centre on hospitality, essential retail, industrial and trade businesses, health and fitness, automotive services, and low-involvement business models.
What's Selling April–June 2026
A total of 417 businesses were marked as sold on Bsale during the June quarter, with an average advertised asking price of $547,818. These are the asking prices displayed when listings were marked as sold, not confirmed sale prices, which are rarely disclosed.
What was marked as sold
Services and Food Hospitality were the most common industries, each accounting for around one in five businesses marked as sold, followed by Retail and Beauty and Health at about one in seven each.
Hospitality remained one of the busiest sectors by volume, with cafes, restaurants, takeaway businesses, bars, bakeries and licensed venues marked as sold across both metropolitan and regional markets.
Professional businesses also featured, including accounting practices, bookkeeping firms, managed IT providers, outsourced administration businesses and digital agencies. These appeal where they offer established client relationships, repeat revenue and scalable operating models.
Manufacturing, wholesale and industrial businesses were well represented, with engineering firms, commercial printers, wholesale distributors, timber businesses and construction services among the businesses marked as sold. The automotive sector also recorded steady activity, including tyre and mechanical workshops, truck specialists, caravan repair businesses and hire car operators.
Health, fitness, childcare, education, retail and franchise businesses were also represented, along with online and technology businesses such as software applications, AI-based platforms and online retail. Businesses advertised below $100,000 were marked as sold alongside businesses advertised at well over $1 million.
Where businesses were marked as sold
New South Wales and Queensland together accounted for more than half of the businesses marked as sold, with Western Australia and Victoria making up most of the remainder. The smaller states and territories recorded only a handful each.
Not every completed sale is recorded as sold. Brokers often withdraw listings to maintain confidentiality, and automated broker feeds can mark several listings as sold at once, so the number marked as sold can vary between quarters and is best read as an indicator of activity on Bsale rather than a complete count.
Overall, the June quarter reflects an active sales environment across a broad range of industries and price points, with well-positioned businesses continuing to be marked as sold where pricing, financial performance and operating structure aligned with buyer expectations.
Outlook for the September 2026 Quarter
As the market moves into the new financial year, activity on Bsale is expected to remain active but selective. The end of the financial year is a natural decision point for many owners, prompting reviews of financial performance, tax position, succession planning and exit timing, which may support a fresh pipeline of businesses coming to market in the second half of 2026.
The outlook remains measured. Tax reform discussions following the 2026–27 Federal Budget, interest rates, inflation and rising operating costs are likely to keep buyers disciplined. Funding conditions continue to influence acquisition decisions, particularly for larger or highly leveraged purchases, with buyers placing greater weight on clear earnings, reliable cashflow and realistic asking prices.
Some owners may bring forward succession planning or exit discussions to understand their position before any new rules take effect. Others may delay going to market until they have clearer advice on tax, structure and timing. Either way, the new financial year is likely to place greater emphasis on preparation, accurate financial records and professional advice.
For sellers, the market is likely to favour businesses that are well documented, realistically priced and able to demonstrate consistent performance. For buyers, more choice and steady listing growth mean those with finance arranged and clear criteria will be better placed to act.
Updated October 2026: Bsale has revised how listings are counted for these reports, excluding listings already marked as sold and older listings since removed. National, state, capital city, regional and sold figures in this report have been updated to the current basis, consistent with the September 2026 quarter report.
About This Data
This report is based on listing information entered by brokers and business owners on Bsale. It should be treated as a general guide to trends only, as the data has inherent limitations:
- Asking prices may include stock, plant and equipment, or freehold property. Bsale does not verify the data, or analyse or adjust for what each price includes.
- Prices for businesses marked as sold are the advertised asking prices, not final sale prices, which are rarely disclosed by sellers.
- As a business address is not required when listing, the same business may be advertised more than once, for example by different brokers, and franchise and business opportunities may be advertised in many locations.
- Not all data is provided, updated or entered accurately. Listings may be withdrawn or changed, stay active after a sale, or be marked as sold without full details.
- Listing figures are a snapshot taken on the last day of each quarter.
- The data reflects activity on Bsale only, not all business sales in Australia.
This information is not professional, legal, financial or investment advice and should not be relied on when making financial decisions, such as starting, buying or selling a business. Readers should conduct their own research and obtain independent professional advice.
Tags: market insights quarterly report 2026
About the author

Vanessa Lovie-Yousaf
CEO Bsale Australia
Vanessa Lovie-Yousaf is the CEO and manager of Bsale.com.au, one of Australia’s most trusted business for sale marketplaces since 2000. With 15 ...


