Australia Business Sales Market Report – Bsale Q1 2026
Australia’s business for sale market has entered 2026 with continued momentum, building on the strong finish seen at the end of last year. While transaction volumes have normalised following the December quarter peak, the early months of 2026 highlight a market that remains active, stable, and increasingly focused on higher-quality opportunities.
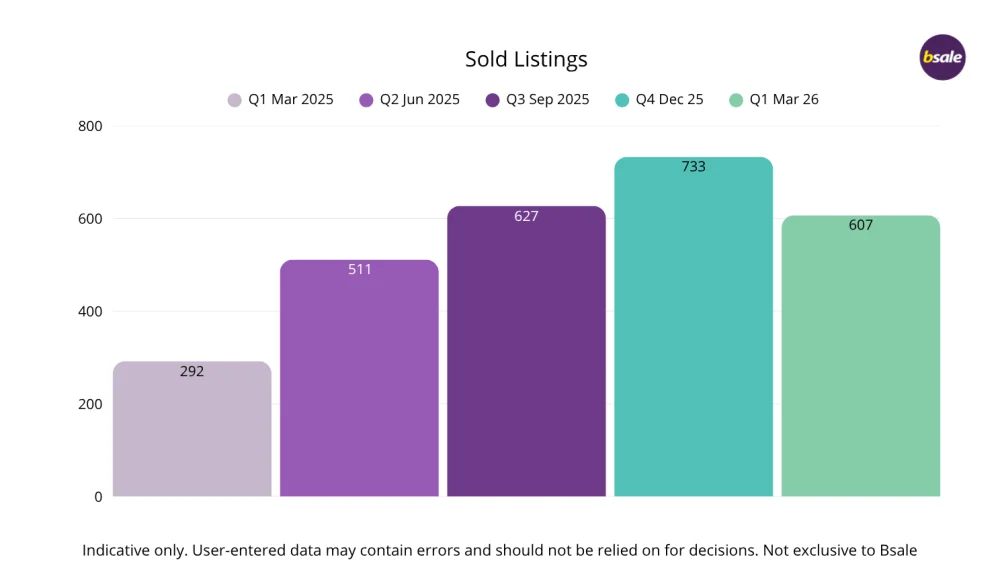
The March quarter recorded 607 businesses marked as sold, with an average advertised sale price of $595,000 an increase of 22.2% from the December quarter. This suggests that while fewer businesses transacted, the deals being completed are, on average, larger and more established.
With more than 16,000 businesses currently advertised for sale nationally, the market continues to offer depth and diversity across sectors. Buyers remain active, but selective, engaging where businesses demonstrate clear financial performance, operational strength, and realistic pricing.
This report is based on advertised listing data from Bsale, including asking prices and listing statuses. As the data is user-entered and business sales often require confidentiality, discrepancies may occur. This report should be used as a general guide only and not relied upon for financial decision-making. Always seek professional advice before making any decisions.
National Overview
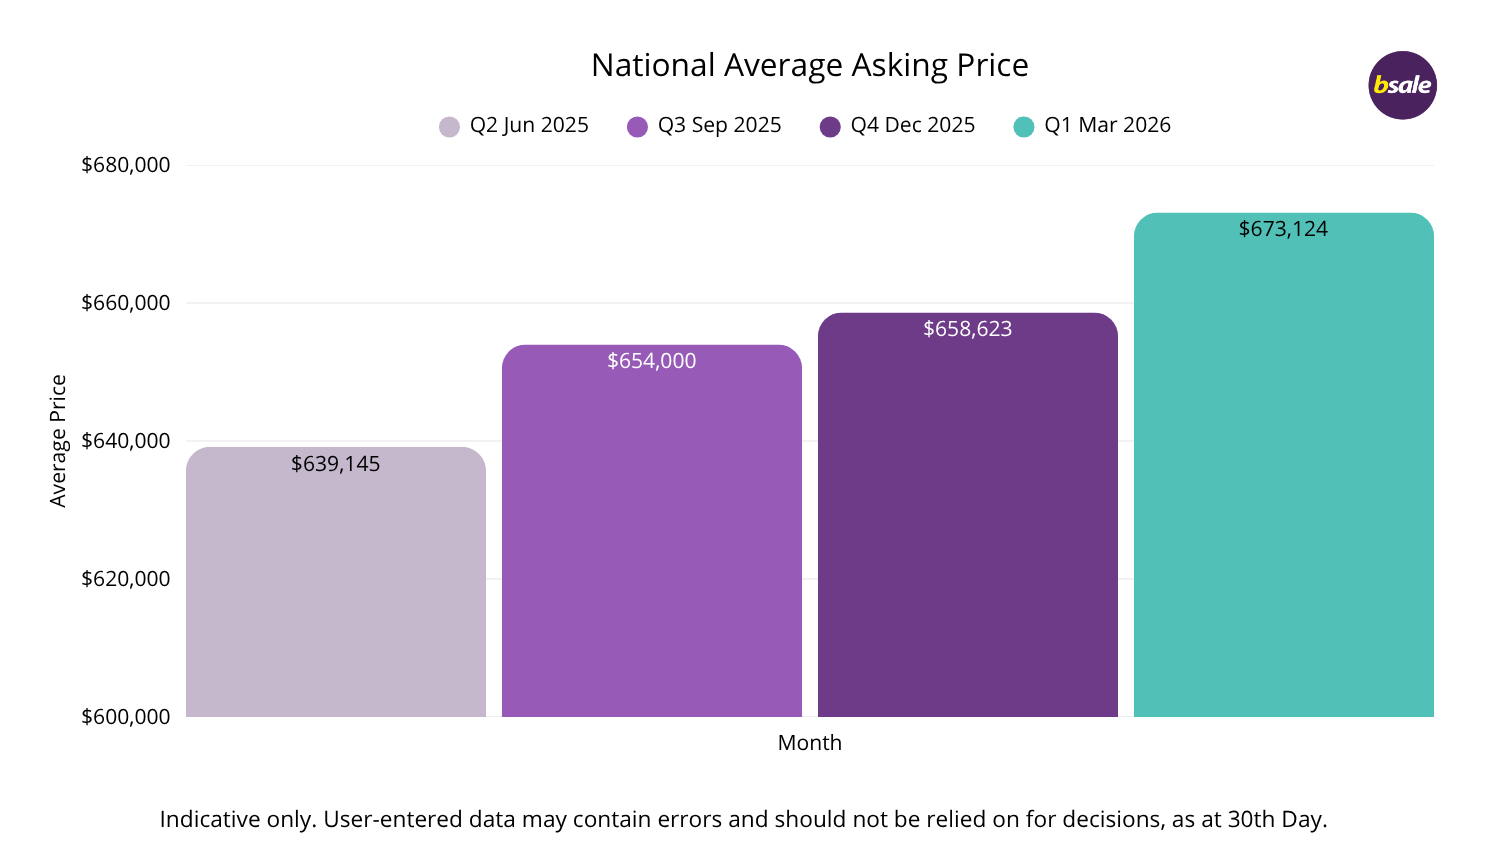
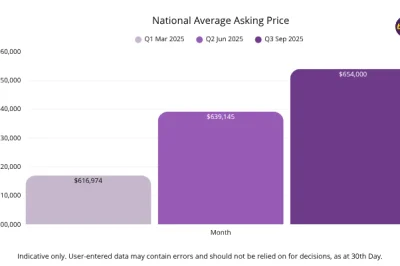
As at March 2026, the national average asking price sits at $673,124, up from $658,623 in December 2025, representing a lift of approximately 2.2%. This continues the gradual upward trend seen throughout 2025, reflecting a steady improvement in the quality and composition of businesses entering the market rather than a sharp increase in pricing.
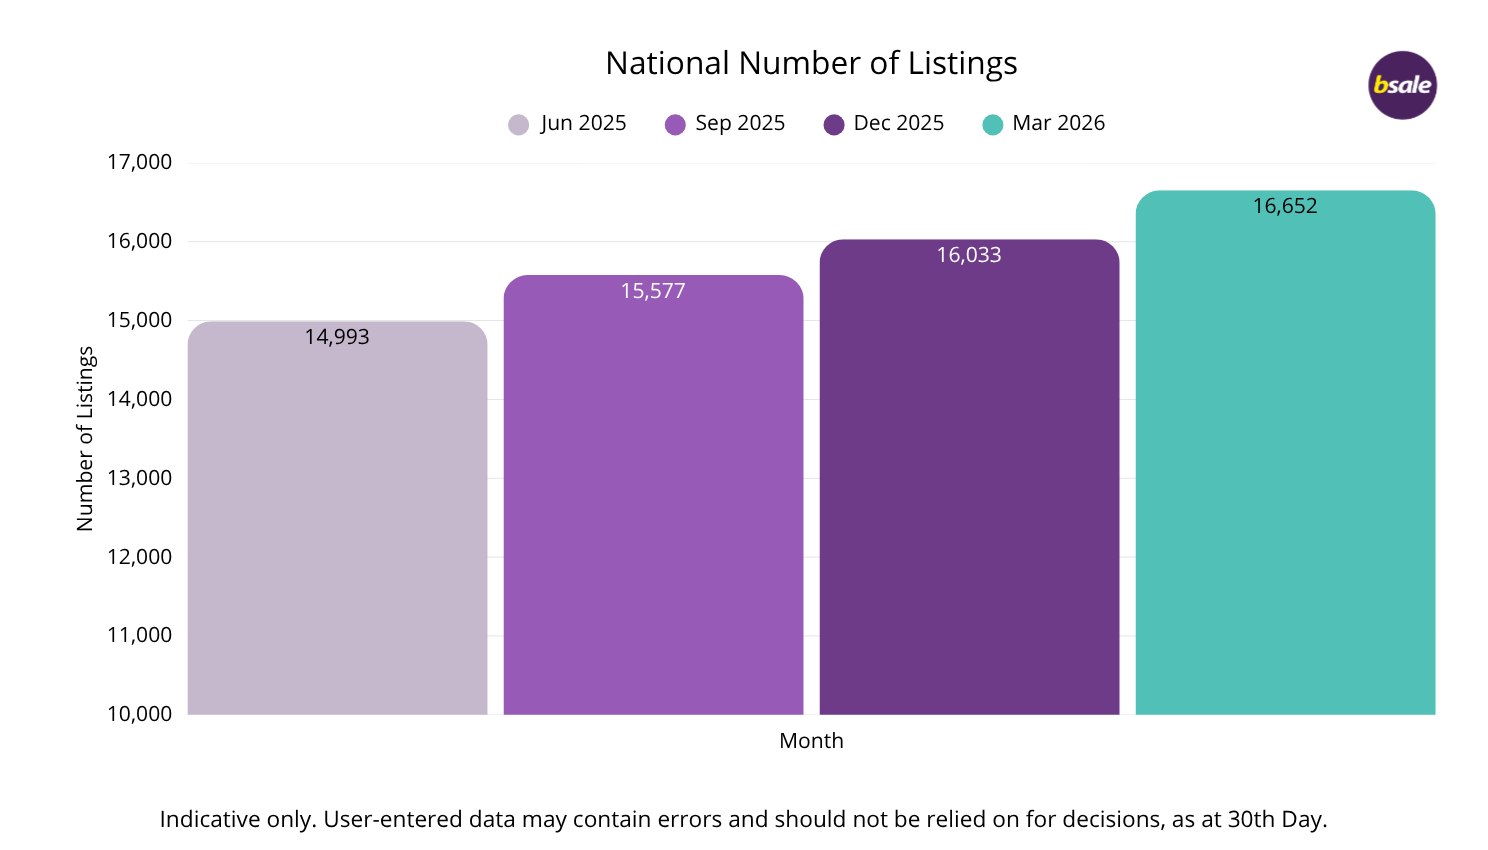
At the same time, listing volumes have also expanded. There are currently 16,652 businesses listed for sale nationally, up from 16,033 in December, an increase of approximately 3.9%. This reinforces growing seller confidence and a continued willingness to bring businesses to market in more stable conditions.
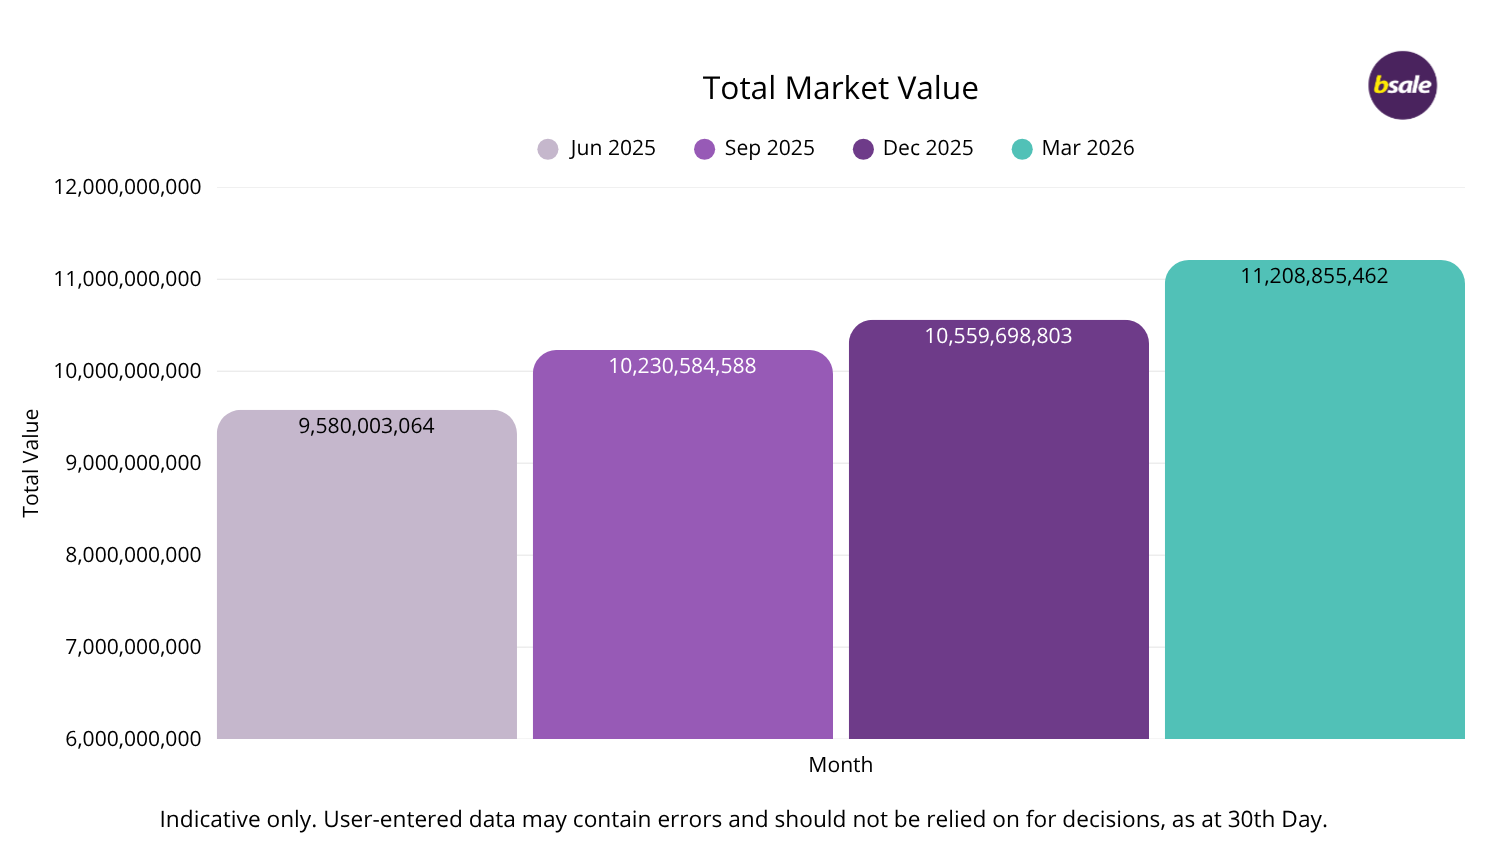
Total advertised market value has increased more strongly over the quarter, rising from approximately $10.56 billion to $11.21 billion, an uplift of around 6.1%. This reflects the combined impact of higher listing volumes and a continued shift toward larger or more established businesses entering the pipeline.
Overall, the national market continues to build steadily. Pricing is lifting at a measured pace, supply is increasing, and the broader mix of businesses coming to market is improving, supporting a stable and balanced environment heading into the second quarter of 2026.
State Analysis
New South Wales
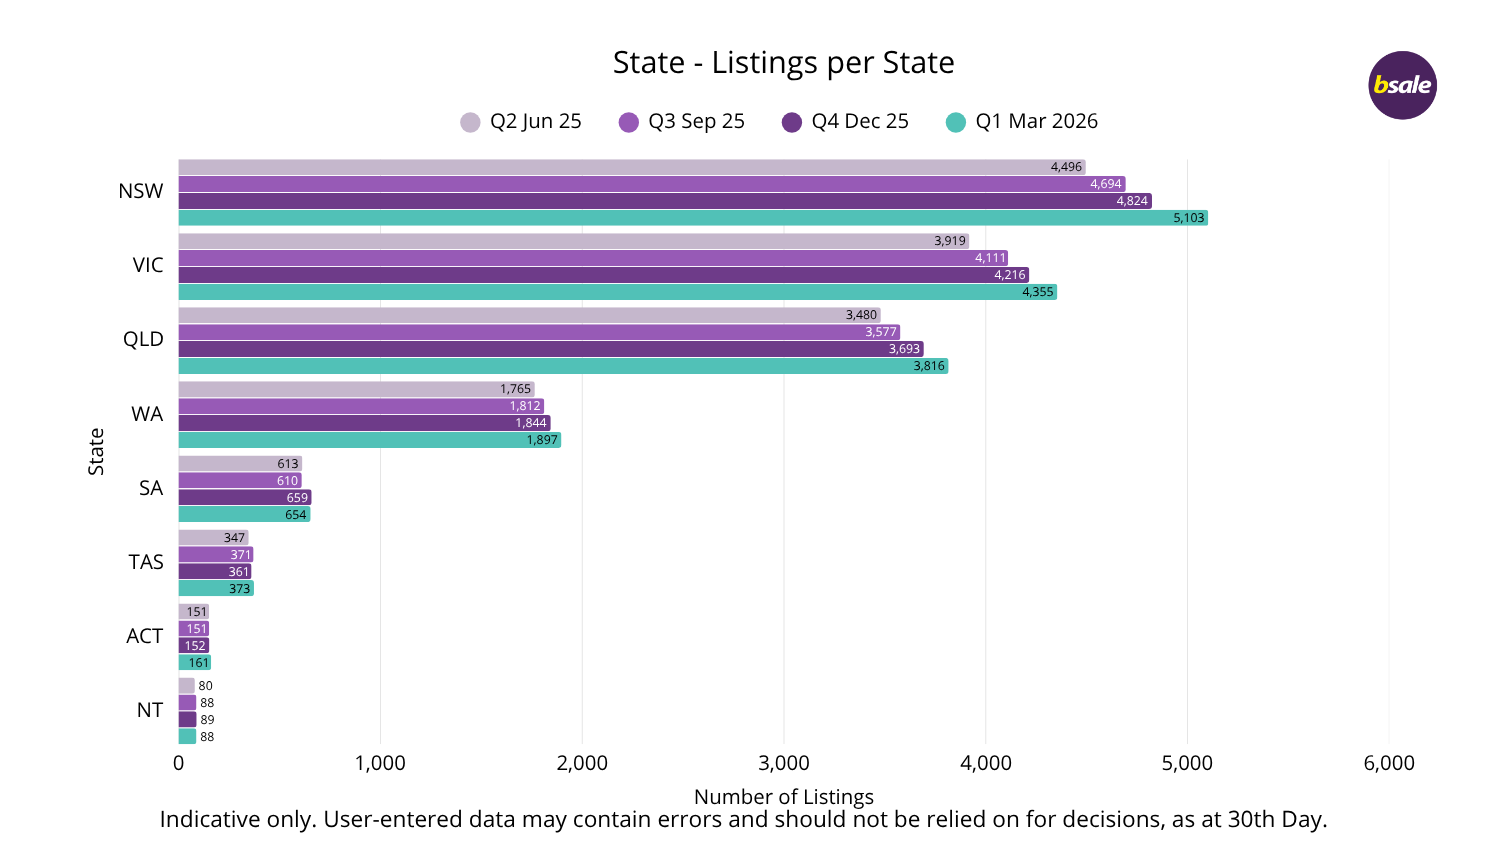
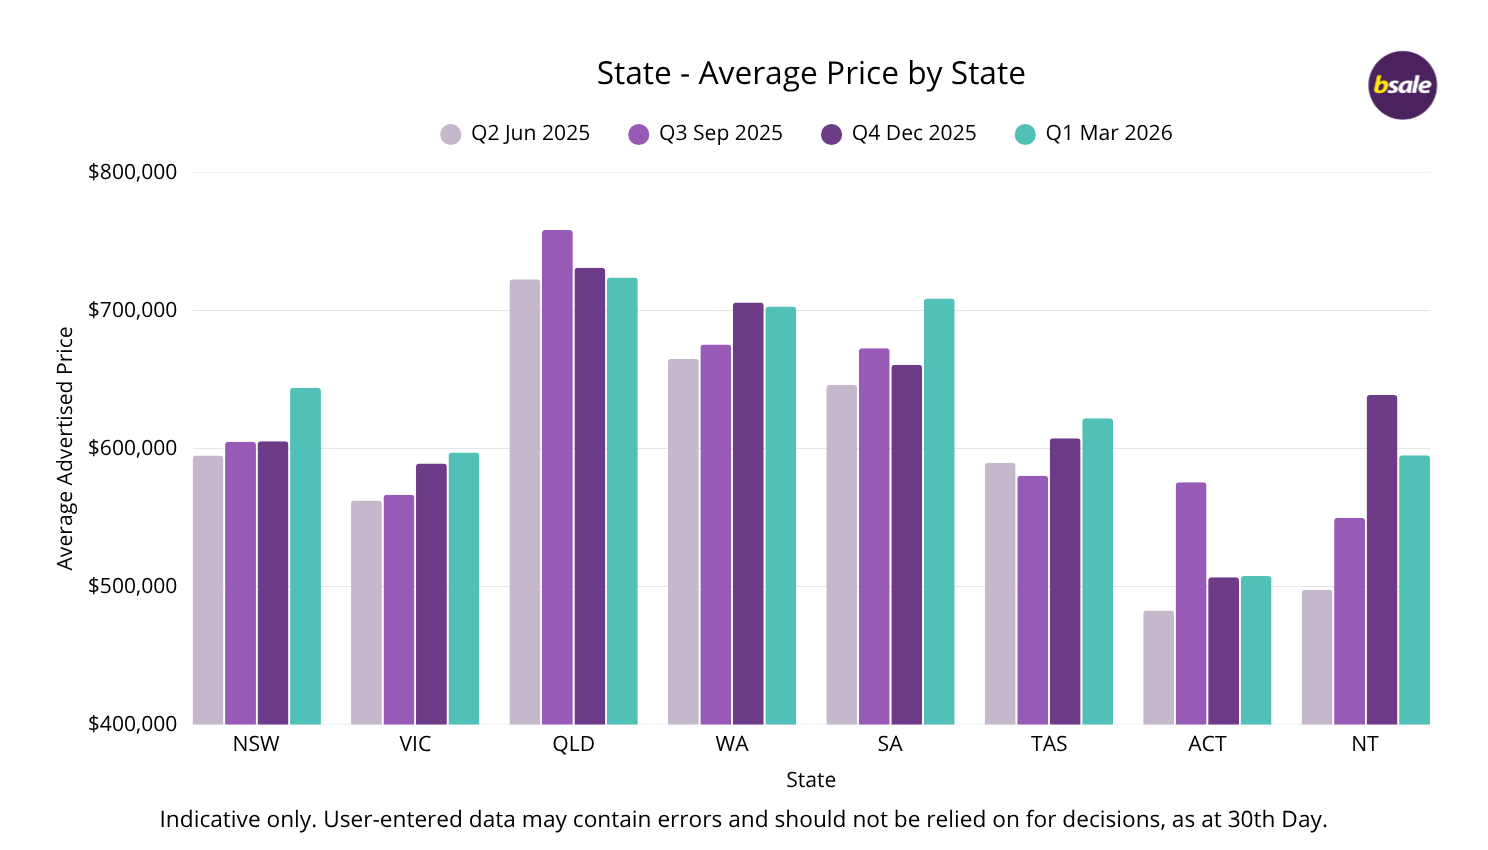
New South Wales continued to expand into early 2026, reinforcing its position as Australia’s largest business market by volume. Listings increased from 4,824 in December to 5,103 in March, up 5.8%, while the average asking price rose from $605,147 to $644,011, an increase of 6.4%.
This is one of the more notable shifts this quarter. NSW recorded one of the strongest increases in average asking price nationally, suggesting a clear uplift in the quality and scale of businesses entering the market. Despite this, pricing remains below the national average, reflecting the state’s depth and concentration of smaller owner-operated businesses.
Victoria
Victoria showed steady, consistent growth through the quarter. Listings increased from 4,216 to 4,355, up 3.3%, while the average asking price rose from $589,072 to $597,097, an increase of 1.4%.
The key takeaway here is stability. Unlike NSW or South Australia, Victoria did not experience a sharp shift in pricing, indicating that the mix of businesses coming to market has remained relatively consistent. This reinforces Victoria’s position as a balanced, high-volume market with strong accessibility for buyers.
Queensland
Queensland remained one of the strongest-performing markets nationally. Listings increased from 3,693 to 3,816, up 3.3%, while the average asking price eased slightly from $730,974 to $723,887, a decline of 1.0%.
While prices softened marginally, Queensland continues to hold the highest average asking price nationally, which is significant. The slight decline appears to be driven by listing mix rather than weakening demand, with continued strong activity across both metropolitan and regional markets.
Western Australia
Western Australia recorded steady growth in listings, increasing from 1,844 to 1,897, up 2.9%, while the average asking price moved from $705,700 to $702,801, a marginal decline of 0.4%.
This quarter highlights a market in equilibrium. Supply is increasing, but pricing remains stable, suggesting that demand is keeping pace. WA continues to perform strongly at the upper end, supported by resource-linked and asset-backed businesses.
South Australia
South Australia recorded one of the strongest price movements nationally. Listings remained relatively stable, moving from 659 to 654 (down 0.8%), while the average asking price increased from $660,742 to $708,764, a rise of 7.3%.
This is the standout pricing result for the quarter. The combination of flat supply and strong price growth suggests a shift toward higher-value businesses entering the market, as well as continued buyer demand for established, well-performing operations.
Tasmania
Tasmania remained steady across the quarter. Listings increased from 361 to 373, up 3.3%, while the average asking price rose from $607,379 to $621,839, an increase of 2.4%.
As a smaller market, Tasmania’s pricing continues to be influenced by listing composition. The modest increase suggests the inclusion of higher-value tourism or hospitality businesses, which can disproportionately impact averages.
Australian Capital Territory
The ACT recorded growth in listing volume, increasing from 152 to 161, up 5.9%, while the average asking price remained largely unchanged, moving from $506,584 to $507,534, an increase of just 0.2%.
The notable point here is flat pricing despite rising supply. This suggests that new listings are entering the market at similar value levels, reinforcing a stable and predictable pricing environment.
Northern Territory
The Northern Territory experienced a notable shift this quarter. Listings decreased slightly from 89 to 88, while the average asking price fell from $638,679 to $595,078, a decline of 6.8%.
Given the small size of the market, this movement is likely driven by changes in listing composition. The removal of a small number of higher-value businesses can significantly impact averages, rather than indicating a broader decline in demand.
Capital City Analysis
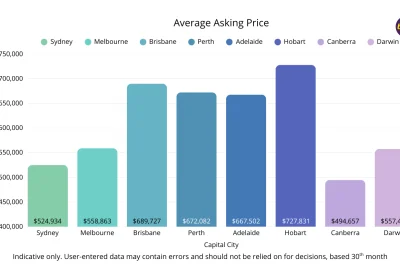
Capital city markets in March 2026 continue to show a clear hierarchy in pricing, with rankings shifting slightly as listing composition evolves. The spread between the highest and lowest-priced capital cities remains significant, reinforcing the differences in market size, business mix, and the presence of higher-value listings.
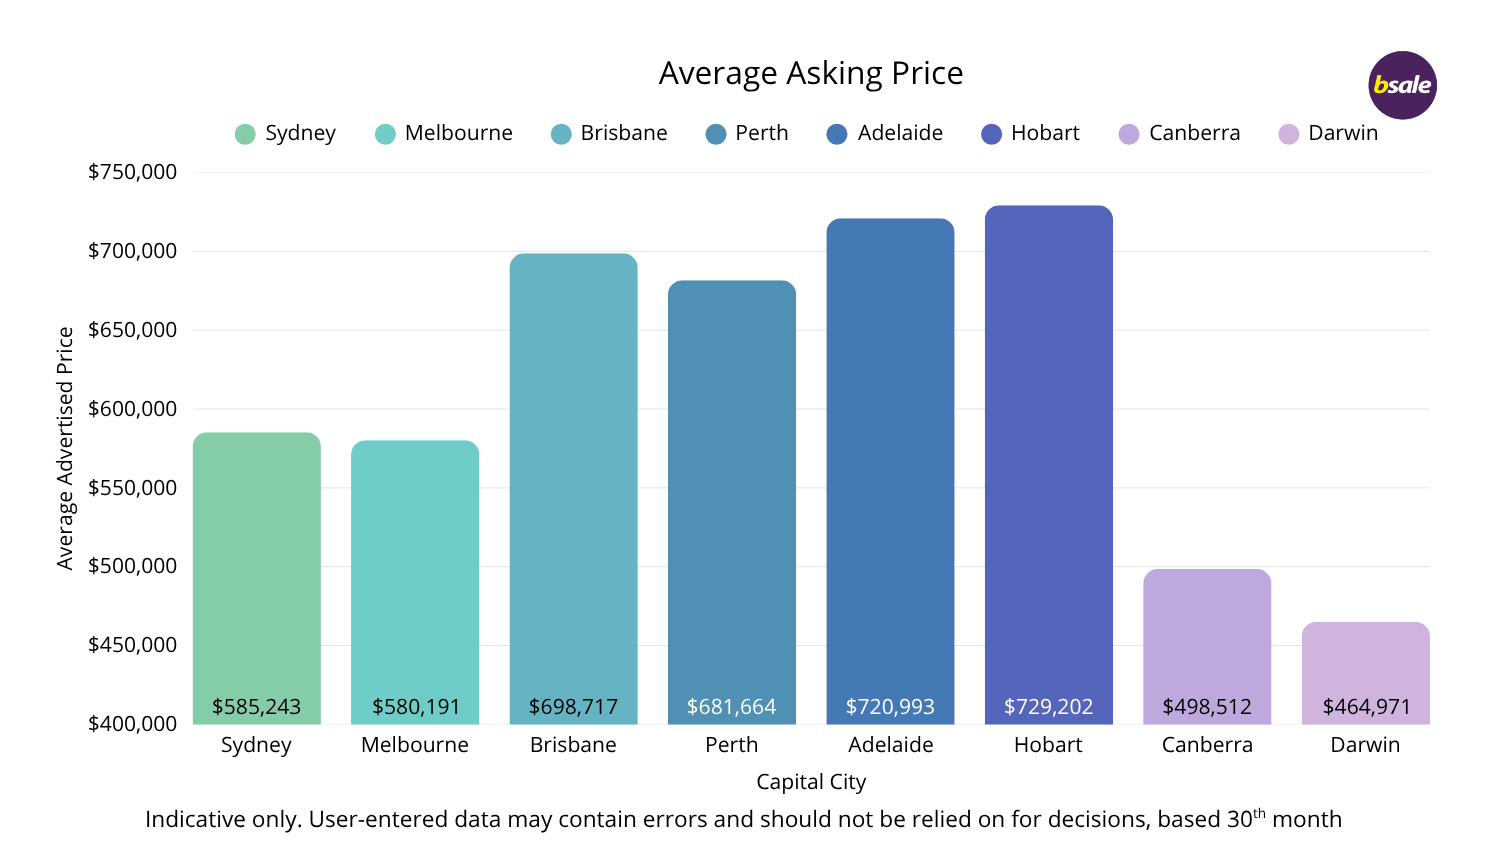
Hobart retained its position as the highest-priced capital city market, holding the number one ranking with an average asking price of $729,202, broadly in line with December’s $727,831. Despite its smaller size, Hobart continues to lead due to the influence of higher-value tourism and hospitality businesses, where even a small number of listings can materially impact averages.
Adelaide has been the standout mover in the March quarter, rising from fourth position in December to second place. Average asking prices increased from $667,502 to $720,993, an 8.0% lift. This shift reflects a stronger presence of higher-value businesses entering the market, combined with continued demand for stable, well-performing operations.
Brisbane now sits in third position, easing slightly from second place in December despite a modest increase in pricing. The average asking price rose from $689,727 to $698,717, up 1.3%. The slight drop in ranking reflects stronger relative growth in Adelaide rather than any weakening in Queensland’s capital market, which remains one of the most consistent performers.
Perth holds fourth position, with average asking prices increasing from $672,082 to $681,664, up 1.4%. The market continues to show steady, incremental growth, supported by resource-linked industries and a stable pipeline of established businesses.
Sydney has recorded one of the more notable shifts in the March quarter, moving from seventh position in December to fifth. Average asking prices increased from $524,934 to $585,243, a significant 11.5% rise. This uplift suggests a stronger mix of mid-sized and higher-value businesses entering the market, although Sydney remains positioned below most other capital cities due to its concentration of smaller, leasehold operations.
Melbourne now sits in sixth position, slipping slightly in ranking despite an increase in average asking price from $558,863 to $580,191, up 3.8%. The relative movement reflects stronger gains in Sydney rather than any weakening in Melbourne itself. As one of the largest markets by volume, pricing continues to be influenced by a high proportion of smaller service and retail businesses.
At the lower end of the rankings, Canberra and Darwin remain the lowest-priced capital city markets. Canberra holds seventh position with an average asking price of $498,512, broadly stable compared to December’s $494,657. The market remains consistent, with movements largely driven by listing mix.
Darwin has experienced the most notable decline in ranking, falling from sixth position in December to last place in March. The average asking price dropped from $557,466 to $464,971, a decrease of 16.6%. In a small market such as Darwin, this shift is likely driven by the removal of higher-value listings rather than a structural change in demand.
Overall, the March quarter highlights a capital city market shaped by relative movement rather than broad shifts in sentiment. Smaller markets such as Hobart and Adelaide continue to lead on pricing, while Brisbane and Perth provide consistency in the upper tier. Sydney and Melbourne remain volume-driven markets with more accessible entry points, and smaller capitals continue to show greater sensitivity to changes in listing composition.
Regional Market Insights
Regional Australia continues to play a significant role in shaping national pricing, particularly at the upper end of the market. The March 2026 data shows a clear divide between high-value regional markets driven by freehold and asset-backed businesses, and lower-priced lifestyle regions offering accessible entry points.
Top 5 Highest-Priced Regional Markets (March 2026)
- Broome & Kimberley (WA) – $1.62M
- Mackay & Central Queensland (QLD) – $1.42M
- Broken Hill & Western NSW (NSW) – $1.33M
- Coral Coast & Mid West (WA) – $1.33M
- Alice Springs (NT) – $1.28M
At the top end, several regional markets continue to record average asking prices well above $1 million. The data highlights Broome & Kimberley as the highest-priced region nationally, holding its position with an average asking price of approximately $1.62 million. Mackay & Central Queensland follows closely at $1.42 million, while Broken Hill & Western NSW and Coral Coast & Mid West WA both remain above $1.3 million.
These elevated averages are not driven by volume, but by deal structure. Many of these regions have a higher proportion of freehold transactions, particularly across accommodation, fuel, transport, and tourism-based businesses. As a result, advertised prices often reflect a combined business and property value, pushing averages well above metropolitan benchmarks.
Resource-linked regions continue to perform strongly. Areas such as the Pilbara, Goldfields, and parts of regional Queensland remain supported by mining, logistics, and essential services. While listing volumes are relatively low, the businesses themselves tend to be larger, more asset-intensive, and less exposed to discretionary spending, which supports higher valuations.
Below this top tier sits a broad mid-market band of regional areas, with average asking prices typically ranging between $700,000 and $900,000. Regions such as the Mid North Coast NSW, Toowoomba & Darling Downs, and Gippsland fall into this category. These markets benefit from a balance of population growth, infrastructure investment, and diversified local economies, making them increasingly competitive with capital cities for buyer attention.
Further down the spectrum are high-volume lifestyle regions, where average asking prices are more accessible. Areas such as the Sunshine Coast, Gold Coast, Newcastle & Hunter Valley, and Geelong typically sit between $550,000 and $650,000. These regions are characterised by a higher concentration of hospitality, retail, and service-based businesses, with fewer freehold opportunities influencing pricing.
At the lower end of the market, several regions continue to provide entry-level opportunities for buyers. The Blue Mountains, Barossa Valley, and Mornington Peninsula all recorded average asking prices between $300,000 and $400,000. These regions are often driven by smaller hospitality and tourism businesses, where lifestyle considerations play a larger role in buyer decision-making.
Across the board, the March quarter reinforces a consistent regional pattern. Higher-priced regions are typically driven by freehold ownership, scale, or essential service positioning, while lower-priced regions offer accessibility but often come with greater exposure to seasonality and operational risk.
Importantly, regional markets continue to compete more directly with capital cities. As affordability pressures persist in metropolitan areas, buyers are increasingly willing to consider regional opportunities that offer stronger returns, lower entry prices, or lifestyle benefits.
Industries
Industry data for March 2026 highlights a clear split between asset-intensive sectors at the top end of the market, essential service businesses around the national benchmark, and high-volume hospitality and service categories at the more accessible end.
At the top of the market, Engineering and Manufacturing continues to lead by a clear margin. The average asking price sits at $1.41 million in March, easing slightly from $1.52 million in December. Building and Construction follows closely at $1.35 million, up from $1.26 million in December. Mechanics has moved firmly into the upper tier, averaging $894,873, reflecting strong demand for automotive services.
Rounding out the top end, Alcohol & Liquor Stores and Supermarkets continue to perform strongly, with average asking prices of $680,017 and $631,845 respectively. These five categories represent the highest-priced industries nationally, driven by a combination of asset backing, recurring demand, and operational scale.
Below this top tier sits a group of essential and semi-essential industries clustered around the national average. Hardware businesses averaged $572,520, while education businesses sat at $494,963 and gyms at $458,207. These categories benefit from repeat customers and structured operations, although they remain sensitive to staffing and operating costs.
A large mid-to-lower tier of service-based businesses continues to provide accessible entry points into ownership. Mobile services, lawn mowing, and general retail typically sit between $400,000 and $450,000. Mobile services showed some short-term volatility, easing from February, which points to changes in listing mix rather than demand.
Hospitality remains the highest-volume sector but continues to sit at the lower end of pricing. Restaurants averaged $397,834, bakeries $379,246, and takeaway businesses $330,991. Cafes, one of the largest categories by volume with over 1,900 listings, averaged $309,810, broadly consistent with previous periods.
This consistency reinforces a key theme. Hospitality businesses are typically leasehold, owner-operated, and sensitive to rent and staffing costs, which limits upward movement in average prices despite ongoing buyer interest.
At the lower end of the market, categories such as cleaning and beauty salons continue to offer the most accessible entry points. Cleaning businesses averaged $328,302, while beauty salons remained the lowest-priced category at $187,588. These businesses are often described as entry-level opportunities, requiring hands-on involvement but offering lower capital requirements.
Overall, the March quarter reinforces a consistent industry structure. Higher-value categories are driven by assets, contracts, and scale, while lower-priced sectors provide accessibility and volume. Buyers continue to segment clearly by budget and risk profile, with strong activity across both ends of the market.
Where Buyers Are Enquiring
Enquiry behaviour in the March 2026 quarter continues to point to a selective and highly practical buyer market. While demand spans a wide range of industries and price points, a clear pattern emerges around cashflow, simplicity, and operational clarity.
One of the strongest signals is continued demand for asset-backed and essential service businesses. Petrol stations, car washes, supermarkets, and liquor stores feature prominently among the most enquired listings. These businesses are typically underpinned by consistent demand and, in many cases, include a freehold or long-term lease structure, making them attractive to both investors and owner-operators.
At the same time, service-based businesses with strong cashflow and low overheads are attracting significant attention. Bookkeeping services, cleaning businesses, vending machine operations, and landscaping businesses all feature heavily in enquiry activity. These models are often scalable, easier to operate, and less reliant on large teams, aligning closely with current buyer preferences.
Hospitality remains active but with a clear shift in expectations. Cafes, takeaway businesses, and small bars continue to generate enquiries, particularly where pricing is accessible or the business is under management. Buyers are showing interest in hospitality, but only where financial performance is clear and risk is reduced.
A notable trend is the continued interest in fitness, health, and personal services. Gyms, wellness hubs, and dental clinics are attracting attention, particularly where there is an established client base or recurring revenue model.
There is also growing engagement with smaller, flexible, and remote-friendly businesses. Online businesses, including AI-led opportunities and digital service providers, are beginning to appear more frequently in enquiry data. While still a small portion of total listings, these businesses are attracting disproportionate interest relative to their size, indicating a shift toward scalable and location-independent models.
Another key insight is the wide spread of price points attracting enquiries. From entry-level businesses under $100,000 through to multi-million-dollar motels and asset-backed operations, buyers are active across the spectrum. This reinforces a segmented market, where different buyer groups are targeting opportunities based on budget, risk profile, and lifestyle preferences.
Geographically, Western Australia features strongly across enquiry activity, particularly in service-based and essential business categories. This aligns with broader trends seen across the state, where pricing remains strong and demand continues to be supported by resource and population dynamics.
Overall, the March quarter highlights a buyer market that is focused, informed, and outcome-driven. Buyers are not simply browsing; they are targeting businesses with clear financials, manageable operations, and proven demand. Across all categories, the common thread is a preference for businesses that are easy to understand, easy to run, and capable of delivering reliable returns.
What’s Selling January–March 2026

A total of 607 businesses were marked as sold across the Bsale platform during the March quarter, representing a combined advertised value of approximately $361.2 million. While this is a decline from the 733 businesses sold in the December quarter (down 17.2%), the overall advertised value of transactions has remained relatively stable, falling just 2.3% from approximately $369.7 million.
The average advertised sale price reached $595,000, up from approximately $487,000 in the December quarter, an increase of 22.2%. This is a notable shift, indicating that while fewer businesses transacted, those that did were, on average, larger and more established. It is important to note that these figures are based on advertised prices, as actual sale prices are typically not disclosed.
The shift is partly seasonal. The December quarter typically captures a surge in deal completions as buyers and sellers aim to finalise transactions before the Christmas and New Year break. In contrast, the early part of the March quarter often reflects a slower pipeline of new listings, as many owners delay launching sales campaigns until after the holiday period.
The average advertised sale price of $595,000 sits below the current average advertised asking price of $673,124 across all businesses for sale. With only 607 businesses marked as sold out of more than 16,000 listings, this reflects the mix of businesses transacting during the quarter rather than a direct comparison between advertised and achieved sale prices.
It is also important to recognise that not all completed transactions are formally recorded as “sold.” In many cases, brokers remove or delete listings to maintain confidentiality, meaning some completed deals may be marked as withdrawn or deleted.
Overall, the March quarter reflects a stable and active market. While transaction volumes have normalised following a strong end to 2025, the increase in average advertised sale price and consistent total value point to ongoing confidence in well-positioned businesses.
Outlook for Q2 and the Year Ahead
With 607 businesses sold in the March quarter, transaction activity is expected to build from here as the market moves into one of its most active periods. The lead-up to 30 June typically brings increased urgency, with buyers and sellers working toward completing deals before EOFY. Based on current momentum, it is likely that transaction volumes will lift through the second quarter.
At the same time, a new wave of businesses is expected to enter the market in the new financial year. EOFY remains a natural decision point for many owners, whether driven by tax planning, performance review, or long-term exit strategy, and this is likely to support continued growth in listings into the second half of 2026.
Global conditions are becoming more complex. Ongoing tensions involving Iran are contributing to volatility in fuel prices, which can flow through to inflation, operating costs, and interest rate expectations. These factors have the potential to influence business profitability, lending conditions, and buyer confidence, particularly in sectors sensitive to cost pressures.
However, the impact is unlikely to be evenly felt. Businesses with stable earnings, strong margins, and clear operating structures are expected to continue attracting buyer interest, particularly where sellers are realistic and prepared to act decisively. In contrast, businesses under pressure may take longer to transact or require more flexible deal structures.
The key trend to watch is a continued shift toward quality. Buyers remain active, but disciplined, focusing on businesses that can demonstrate resilience and consistency in changing conditions.
Overall, the outlook for 2026 remains positive. Activity is expected to increase through Q2, supported by EOFY-driven transactions and a fresh pipeline of listings, with well-positioned businesses continuing to transact despite broader economic uncertainty.
Note: This report is based on listing information entered by users on Bsale and should be treated as a general guide only. Due to the nature of business sales, not all data is always provided, updated, or entered accurately, and advertised prices may differ from final sale prices. Listings may also be withdrawn, changed, or marked as sold without full details being available, resulting in an inherent margin for error in the data. This information should not be considered professional, financial, or investment advice and should not be relied upon when making business or purchasing decisions. Readers should conduct their own research and obtain independent advice where appropriate.
Tags: market insights quarterly report australia
About the author

Vanessa Lovie-Yousaf
CEO Bsale Australia
Vanessa Lovie-Yousaf is the CEO and manager of Bsale.com.au, one of Australia’s most trusted business for sale marketplaces since 2000. With 15 ...