Australia Business Sales Market Report – Bsale Q4 2025
Australia Business Sales Market Report – Bsale Q4 2025
Australia’s business for sale market finished 2025 in a much stronger position than it began. The December quarter was the standout, delivering the highest number of businesses marked as sold for the year, even though the average advertised sold price softened. That combination tells an important story, that deals are getting done, not because prices are being pushed up, but because buyers and sellers are meeting in the middle.
Throughout 2025, listings rose steadily, enquiries stayed focused on established and well-priced businesses, and momentum carried through to year-end despite the usual Christmas slowdown. With 733 businesses marked as sold in the December quarter and more than 16,000 businesses advertised nationally, the market is clearly active, but not rushed. Buyers are moving where the numbers make sense, and sellers are showing a growing willingness to price realistically to achieve a result.
This report is based on advertised listing data on Bsale, including asking prices and listing statuses. All prices referenced are advertised prices only and do not reflect final sale outcomes. In some cases, listings are removed or marked as sold without updated pricing information. The insights should be read as a guide to market direction and behaviour, rather than exact transaction values.
National Overview
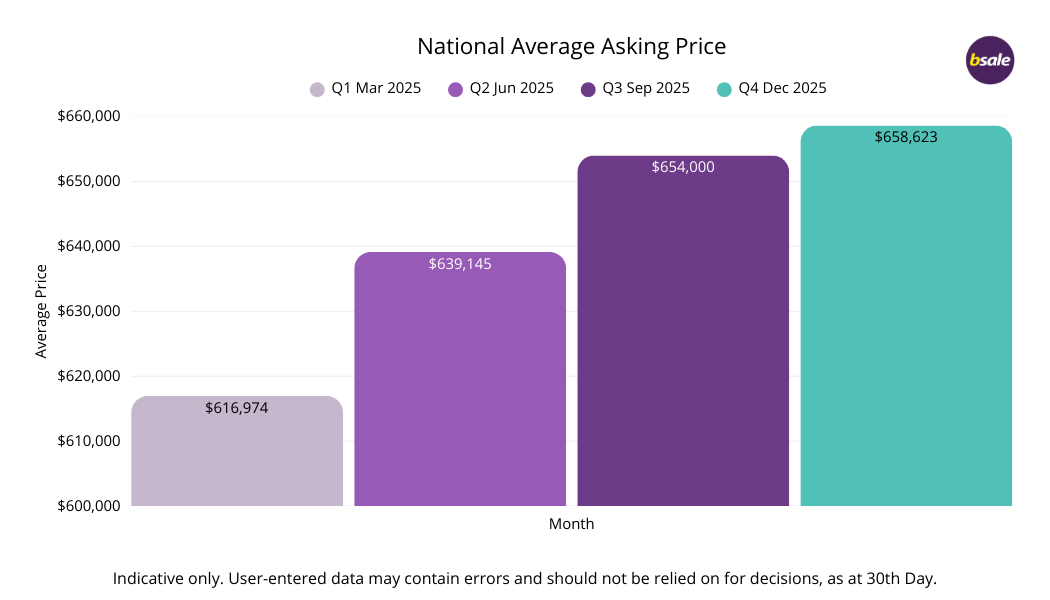
The national average asking price rose steadily through 2025, increasing from $616,974 in March to $658,623 by December, reinforcing a year-long trend toward higher-value businesses entering the market rather than a short-term pricing spike.
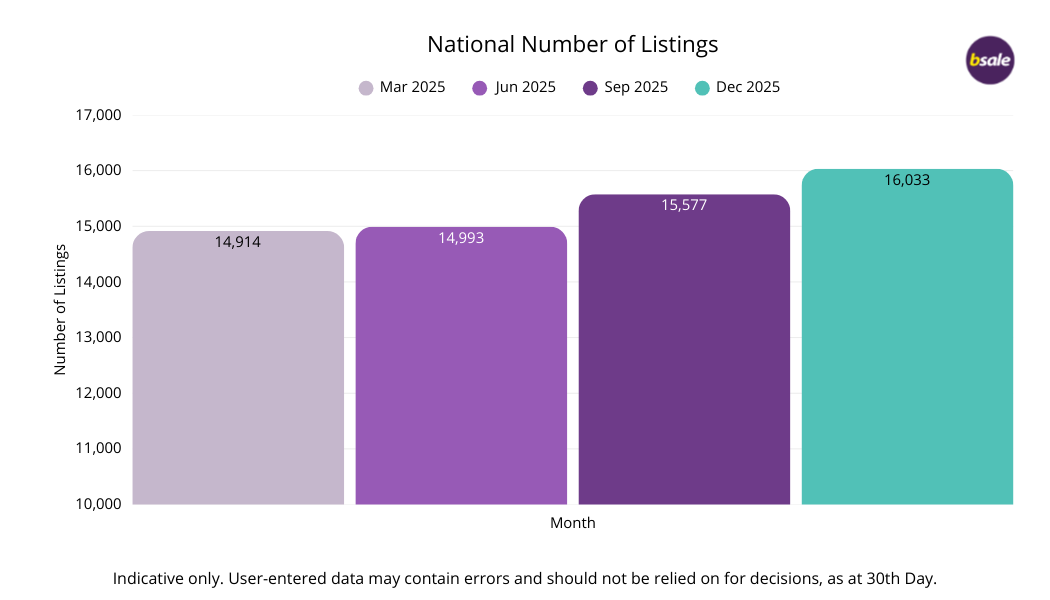
The number of businesses listed for sale increased steadily across 2025, rising about 7.5% from 14,914 in March to 16,033 by December, signalling growing seller confidence and a broader range of opportunities entering the market. With the addition of new business brokers to Bsale, this has also increased our listing numbers.
..png)
Total advertised market value climbed consistently through 2025, rising from $9.2 billion in March to $10.56 billion by December, reflecting both the increase in listings and a steady shift toward higher-value businesses coming to market.
Listings increased quarter by quarter, average asking prices edged higher, and total advertised market value grew at a faster pace than supply, indicating that confidence improved without tipping into unrealistic pricing. Sellers became more active as conditions stabilised, while the gradual lift in average prices suggests a better mix of established and higher-quality businesses entering the market. When we break it down by state you can see some clear trends.
State Comparisons
State-level pricing trends in 2025 reveal meaningful differences across Australia, shaped by local economic conditions, government policies, industry mix, and market depth. While most states recorded steady upward movement in average asking prices through the year, the scale and consistency of change varied considerably. Larger markets such as New South Wales, Queensland, Victoria, and Western Australia tend to move more gradually due to their depth and diversity.
Smaller markets including the Northern Territory, the ACT, and Tasmania are inherently more volatile. In these smaller states, the addition or removal of just a few higher-value or freehold businesses can materially shift average prices from quarter to quarter, meaning movements should be read as directional signals rather than structural changes in underlying demand.
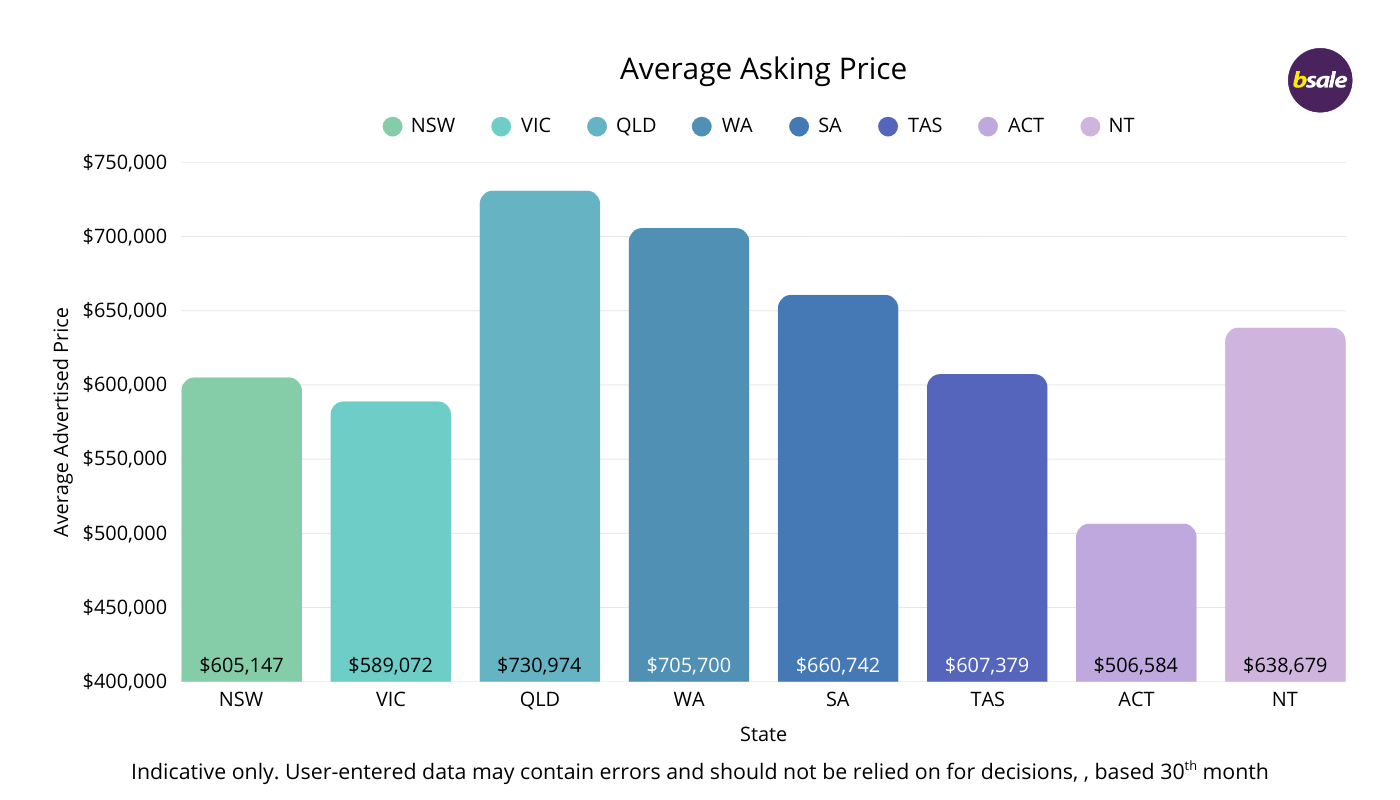
Image: Average pricing per state, businesses for sale across Australia, December 30, 2025.
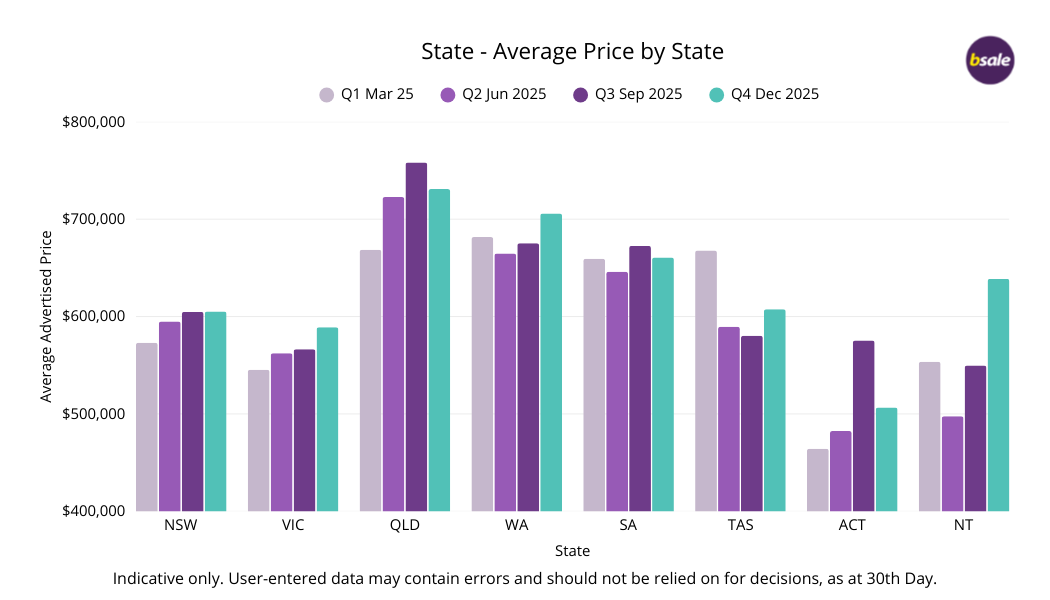
Image: Average pricing by state of businesses for sale across Australia, December 30, 2025.
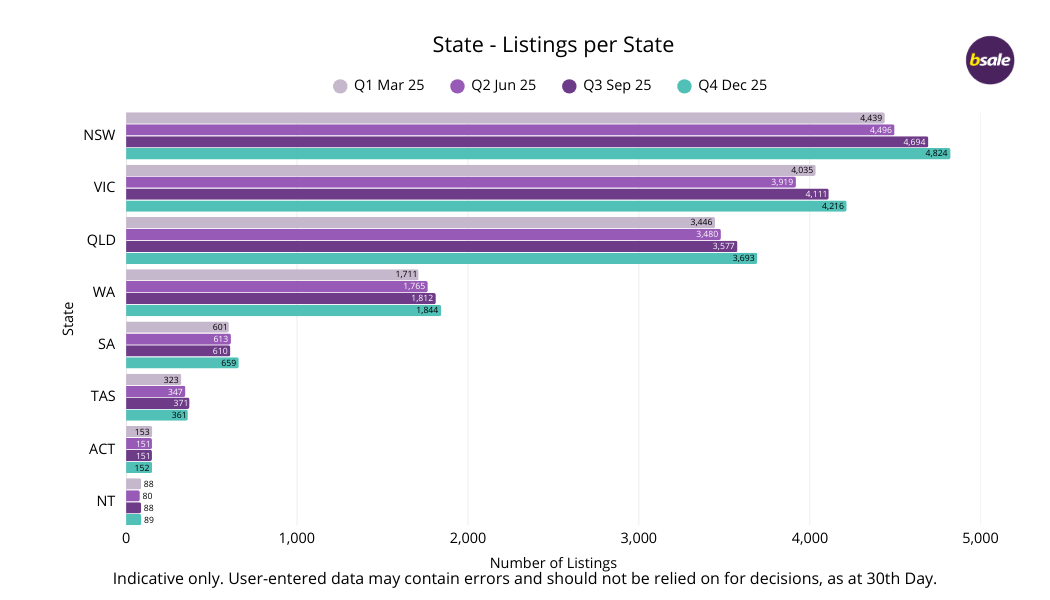
Image: Total listings by state of businesses for sale across Australia, December 30, 2025.
New South Wales
New South Wales showed a steady, measured recovery through the second half of the year. From March’s average asking price of $573,137, prices gradually lifted to $605,147 by December, a rise of 5.6%. Over the same period, listings increased from 4,439 in March to 4,824 by December, up 8.7%, reinforcing NSW’s position as Australia’s largest business market by volume.
While price growth was modest, it reflects the scale and diversity of the market. NSW pricing remains moderated by a high concentration of smaller owner-operated and leasehold businesses, but the late-year stabilisation suggests expectations between buyers and sellers became better aligned.
Sydney averaged $524,934 in December, ranking 7th among capital cities and sitting well below the national average. Despite being Australia’s largest capital city market by listing volume, pricing remains subdued due to the dominance of service-based and owner-operator businesses rather than any lack of activity.
Victoria
Victoria experienced a softer start to the year before regaining momentum into the second half. Average asking prices recovered from $545,457 in March to $589,072 by December, an increase of 8.0%. Listings also strengthened into year-end, rising from 4,035 in March to 4,216 in December, up 4.5%.
The parallel lift in pricing and supply points to improving confidence and a stronger mix of businesses entering the market later in the year.
Melbourne averaged $558,863 in December, ranking 6th among capital cities and remaining below the national average. With a deep and diverse pool of listings, Melbourne’s pricing continues to reflect the high proportion of smaller service and retail businesses that characterise the market.
Queensland
Queensland remained the strongest state market on pricing throughout the year. From March to December, average asking prices rose from $668,641 to $730,974, an increase of 9.4%, despite some easing from peak levels late in the year. Listings increased steadily alongside pricing, rising from 3,446 in March to 3,693 by December, up 7.2%.
The combination reinforces Queensland’s position as both a high-value and high-volume market, underpinned by population growth and long-term infrastructure investment.
Brisbane averaged $689,727 in December, ranking 2nd among all capital cities and continuing to price above the national average. Population growth, business migration, and infrastructure investment continued to support higher-value businesses entering the market.
Western Australia
Western Australia experienced an early recalibration before strengthening into year-end. From March’s average asking price of $681,564, prices lifted to $705,700 by December, a rise of 3.6%. Listings also rose across the same period, increasing from 1,711 in March to 1,844 in December, up 7.8%.
The late-year uplift suggests improved business quality and resilience, supported by resource-linked activity and essential services demand.
Perth averaged $672,082 in December, ranking 3rd among capital cities and sitting above the national benchmark. Pricing strength continues to be supported by established businesses and asset-linked opportunities.
South Australia
South Australia remained one of the most stable markets across the year. Average asking prices moved only marginally from $659,323 in March to $660,742 by December, indicating steady demand. While pricing held, listings increased from 601 in March to 659 by December, up 9.6%, suggesting the market absorbed higher supply without meaningful downward pressure on prices. Stability rather than growth defined the market.
Adelaide averaged $667,502 in December, ranking 4th among capital cities and sitting marginally above the national benchmark. Demand remained focused on well-run, established businesses rather than expansion-led opportunities.
Tasmania
Tasmania reflected the volatility typical of smaller markets. From March’s average asking price of $667,929, prices eased to $607,379 by December. Over the same period, listings increased from 323 in March to 361 by December, up 11.8%, indicating that changes in listing mix played a significant role in the year’s pricing movements. As a smaller market, Tasmania’s averages can be more sensitive to the addition or removal of a small number of higher-value listings.
Hobart recorded an average asking price of $727,831 in December, ranking 1st among all capital cities. As a smaller capital market, a limited number of higher-value tourism and hospitality businesses can materially influence averages.
Australian Capital Territory
The ACT showed improvement across the year, although movements remain sensitive due to the market’s size. From March to December, the average asking price increased from $464,191 to $506,584, while listings were essentially unchanged, moving from 153 in March to 152 in December. With a compact listing base, price shifts tend to reflect composition rather than broad changes in sentiment.
Canberra averaged $494,657 in December, ranking 8th among capital cities and remaining the lowest-priced capital city market nationally.
Northern Territory
The Northern Territory recorded the strongest price growth of any state across the year. From March’s average asking price of $553,555, prices rose sharply to $638,679 by December, an increase of 15.4%. Listings were largely stable over the same period, edging from 88 in March to 89 in December, meaning the uplift was driven by listing mix rather than widespread repricing. In a small market, the introduction of a handful of higher-value businesses can significantly move the average.
Darwin averaged $557,466 in December, ranking 5th among capital cities and sitting below the national benchmark, with pricing sensitive to listing mix.
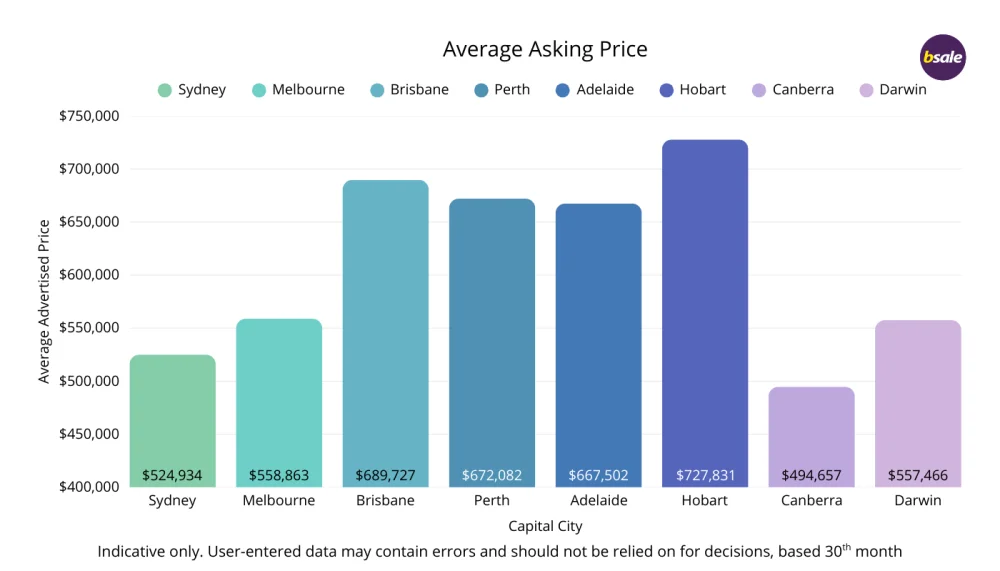
Capital City Analysis
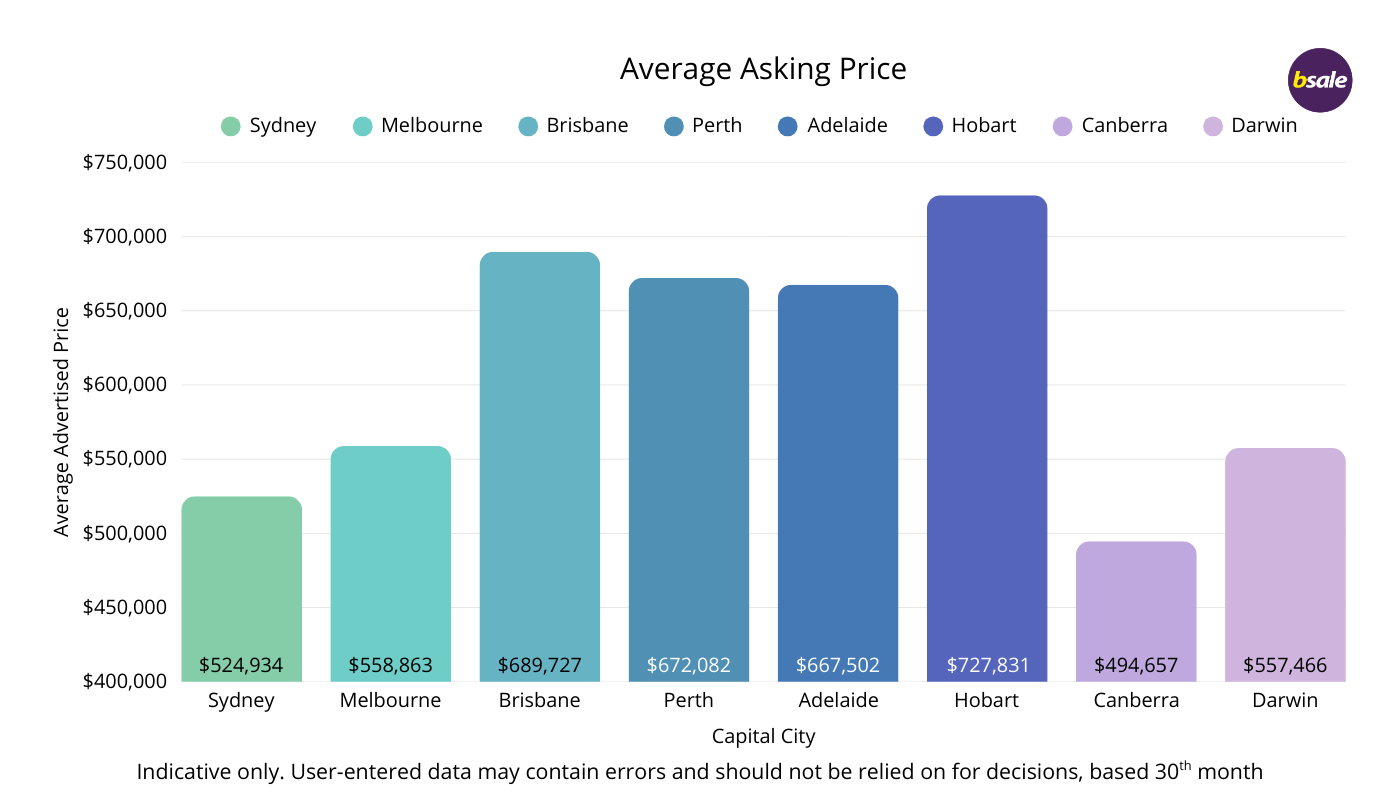
Image: Average pricing per capital city, businesses for sale across Australia, December 30, 2025.
Capital city markets showed a wide spread in average asking prices at the end of 2025, reflecting differences in market size, business mix, and the presence of higher-value listings.
Hobart stood out nationally, recording the highest average asking price of all capital cities at $727,831. While Tasmania remains a smaller market by volume, Hobart’s pricing continues to be influenced by a limited pool of listings and the presence of higher-value hospitality and tourism businesses. As with other smaller capitals, movements in average price can be more pronounced, but the result highlights continued demand for quality Tasmanian businesses.
Brisbane followed as the next highest-priced capital city, with an average asking price of $689,727. Strong population growth, interstate migration, and a steady flow of established businesses have supported pricing in Queensland’s capital, particularly across hospitality, services, and asset-backed opportunities.
Perth and Adelaide formed the next tier, with average asking prices of $672,082 and $667,502 respectively. Perth continues to benefit from a solid economic backdrop and an increasing mix of larger businesses coming to market, while Adelaide’s results reflect a stable, consistent market where well-run businesses continue to attract buyer interest.
In the larger eastern capitals, pricing remained more moderate. Melbourne averaged $558,863 across more than 3,100 listings, reflecting the city’s depth and diversity, with a high proportion of smaller service and retail businesses keeping averages in check. Sydney, despite being Australia’s largest business market by listing volume, recorded an average asking price of $524,934. The prevalence of leasehold and owner-operator businesses continues to weigh on average pricing, even as overall activity remains high.
At the lower end of the capital city spectrum, Darwinand Canberra recorded average asking prices of $557,466 and $494,657 respectively. Both markets are smaller and more sensitive to changes in listing mix, with fewer large-scale opportunities influencing overall averages.
Regional Market Insights
Regional Australia continues to shape the national pricing story, particularly at the upper end of the market. Several non-capital regions recorded average asking prices well above the national benchmark of approximately $659,000. each exceeded $1.3 million. These figures sit well above most capital city averages and highlight how regional markets can outperform metropolitan centres on price, despite smaller listing volumes.
Regional Australia continues to shape the national pricing story, particularly at the upper end of the market. Several non-capital regions recorded average asking prices well above the national benchmark of approximately $659,000. Broome and the Kimberley stood out with averages above $1.6 million, while Mackay and Central Queensland, and Wagga Wagga and the Riverina, each exceeded $1.3 million. These figures sit well above most capital city averages and highlight how regional markets can outperform metropolitan centres on price, despite smaller listing volumes.
In many cases, elevated regional averages reflect deal structure rather than operating value alone. Regional and remote listings are more likely to include a freehold component, particularly in sectors such as accommodation, fuel, transport, tourism, and essential services. Because advertised prices typically reflect a combined business and property asking price, regions with a higher proportion of freehold transactions naturally record higher averages than capital cities, where leasehold businesses dominate.
Resource and infrastructure linked regions also continue to price above the national average. Parts of the Pilbara, Goldfields, and Central Queensland feature businesses servicing mining, logistics, and remote communities. Listing volumes in these areas are often low, but individual enterprises tend to be larger, more asset-intensive, and less exposed to discretionary spending. As a result, average asking prices in these regions frequently sit above both the national benchmark and many capital city markets.
At the lower end of the regional spectrum, several lifestyle-oriented areas recorded average asking prices in the $300,000 to $400,000 range. Regions such as the Barossa Valley, Blue Mountains, and Mornington Peninsula fall into this category, typically characterised by smaller hospitality, retail, and tourism businesses where freehold ownership is less common. Lower entry prices make these areas attractive to first-time buyers and lifestyle-focused operators, though seasonality and margin sensitivity are often part of the trade-off.
Between these extremes sits a broad mid-tier of regions with average asking prices close to the national benchmark. The Sunshine Coast, Mid North Coast NSW, Newcastle and Hunter Valley, Geelong, and Toowoomba generally recorded averages around $700,000 to $750,000. These regions offer a balance of scale and accessibility, benefiting from population growth, infrastructure investment, and diversified local economies. Increasingly, they are competing directly with capital cities for buyer attention, particularly as affordability pressures persist in metro markets.
Overall, the regional data reinforces that location alone does not dictate value. Regions pricing above the national average often reflect freehold ownership, business scale, or essential service positioning, while lower-priced regions provide accessible entry points with different lifestyle and risk profiles. Capital cities remain liquid and competitive, but regional Australia continues to offer some of the most compelling pricing diversity as the market heads into 2026.
Industries
Category data shows a clear split between high-volume hospitality listings, asset-backed industries, and service-based entry points.
Hospitality continues to dominate by volume. Cafes, takeaway food, restaurants, bakeries, catering, and related food categories make up a large share of active listings. Yet average asking prices across hospitality typically sit well below the national benchmark, generally around the $300,000 to $405,000 range. This reflects the leasehold nature of many venues, owner-operated models, and sensitivity to rent and staffing.
At the top end, asset-intensive categories command materially higher advertised prices. Engineering and manufacturing averaged above $1.5 million. Building and construction averaged around $1.26 million. These sectors often involve higher profitability, equipment, contracts, and sometimes property, which drives higher advertised valuations and attracts more experienced buyers.
Essential services tend to cluster closer to the national average. Mechanics averaged around $748,000, sitting above the benchmark, reflecting repeat demand and essential status. Liquor stores averaged roughly $654,000, broadly in line with the national average, while supermarkets averaged about $627,000, just under it. These categories are supported by recurring consumer demand and community reliance.
A middle band sits below the national average but above entry-level. Gyms, education businesses, and hardware stores typically fall around $450,000 to $520,000. These categories often benefit from repeat customers and established systems, but buyers remain mindful of staffing and operating costs.
Lower-priced service categories remain the most accessible pathway into ownership. Cleaning, lawn mowing, mobile services, and beauty salons generally sit well below the national benchmark. These businesses appeal to owner-operators and first-time buyers. They are often referred to as 'buying a job' as they tend to be smaller and require a fulltime owner-operator.
Where Buyers are Enquiring
Enquiry behaviour through Q4 points to a more deliberate market. Interest concentrates around listings that clearly communicate structure, profitability, and operational readiness. Buyers are not just browsing. They are filtering fast.
Hospitality still attracts strong attention, but the wording that performs best is telling. Listings described as established, profitable, under management, or multi-site consistently rise to the top. Lifestyle alone is no longer enough. Buyers are looking for systems and certainty.
Essential services remain an anchor. Childcare, supermarkets, post offices, newsagencies, butcher shops, car washes, laundromats, and similar community-based operations continue to draw attention because they trade through cycles and rely less on discretionary spending.
Health and fitness also remain consistent, particularly independent gyms and 24/7 models. Subscription-style revenue and repeat visit behaviour keep these categories attractive, especially where costs are controlled.
There is also growing engagement with operational service businesses such as cleaning, security, bookkeeping, machinery hire, logistics, and distribution. These businesses often scale through contracts rather than foot traffic, which helps explain the sustained interest.
A final signal worth noting is the emergence of technology-led listings attracting disproportionate attention relative to their volume. Businesses surrounding tech, apps and AI have been gaining more enquiries, even when listings are low.
What’s Selling October–December 2025
..png)
The December 2025 quarter delivered the strongest sales result of the year, with 733 businesses marked as sold. That is a 17% increase on the September quarter and a 66% year-on-year rise compared to Q4 2024, when 441 businesses sold. This is a standout result for a quarter usually disrupted by holiday slowdowns. Transaction activity did not ease into year-end. It accelerated.
Advertised pricing on sold listings reinforces how grounded and how disciplined this market remains. The average advertised price of sold businesses in Q4 was approximately $487,000, sitting well below the national average asking price of around $659,000.
This represents a notable shift from the September quarter, where the average advertised price for sold listings climbed to $571,000, up from $545,000 in June a quarterly increase of roughly 4.8%. By comparison, the December quarter average declined by around 14.7% from September, highlighting a clear change in the mix of businesses transacting rather than a deterioration in confidence.
With more than 16,000 businesses advertised for sale nationally and 733 transactions marked as sold during the quarter, the data points to a selective but well-functioning market. Buyers are not absorbing supply evenly; instead, they are concentrating activity in more accessible price brackets where finance, due diligence, and settlement can be completed efficiently.
The December quarter results suggest that while confidence remains strong, buyers became more price-conscious toward year-end, favouring smaller and mid-sized opportunities over higher-value or more complex deals.
It is also important to note that all pricing data reflects advertised figures only. Final sale prices are not always disclosed, and some listings are removed or marked as sold without updated price information being provided.
The Q4 figures show a market that is active but realistic. The pullback in average advertised sold prices, alongside a sharp increase in transaction volume, suggests momentum driven by execution rather than inflation. Buyers are transacting where expectations align, reinforcing a healthier cycle built on choice, discipline, and confidence heading into 2026.
The types of businesses selling also reflect a fundamentals-first buyer base. Hospitality remains the most consistently transacting sector, especially cafes, coffee shops, takeaway, and smaller restaurants. Service businesses feature strongly as well, including cleaning, mobile services, fitness, and professional services. Essential businesses continue to trade reliably, including community retail and automotive services, where demand is more defensive.
Location also matters. Sold activity remains strongest outside major CBDs. Suburban and regional businesses continue to feature heavily, aligning with buyer preference for affordability, loyal local demand, and sustainable operating environments.
Heading into 2026
The market enters 2026 with momentum, but it is likely to remain selective. Financing conditions appear more stable than they were in prior years, but buyers are still cautious and are doing extensive due diligence. That mix supports continued deal flow without creating a runaway valuation cycle.
Three themes are likely to shape 2026. The first is ongoing preference for quality, cashflow-positive businesses with clear systems and defensible demand. The second is continued strength in mid-sized and regional markets as buyers chase affordability and lifestyle alongside returns. The third is gradual growth in interest for scalable and modern business models, including technology-led and contract-driven operations, but only where revenue is clear and proven.
Overall, 2026 looks set to reward sellers who prepare well and price realistically, and buyers who focus on stability, systems, and cashflow.
Tags: market insights quarterly report business brokers
About the author
Vanessa Lovie-Yousaf
CEO Bsale Australia
Vanessa Lovie-Yousaf is the CEO and manager of Bsale.com.au, one of Australia’s most trusted business for sale marketplaces since 2000. With 15 ...


