Business Sales Analysis of Capital Cities 2022 vs. 2024

Business Sale Listings in Australian Capital Cities
The Australian business listings market, particularly in capital cities, has shown notable changes between 2022 and 2024. Whether you’re a potential buyer or an investor, understanding these shifts can help you make informed decisions in the current marketplace. Bsale currently has 9,557 listings in capital cities, an increase of 1.34% since 2022.
1. Listings Volume: Melbourne Leads the Way
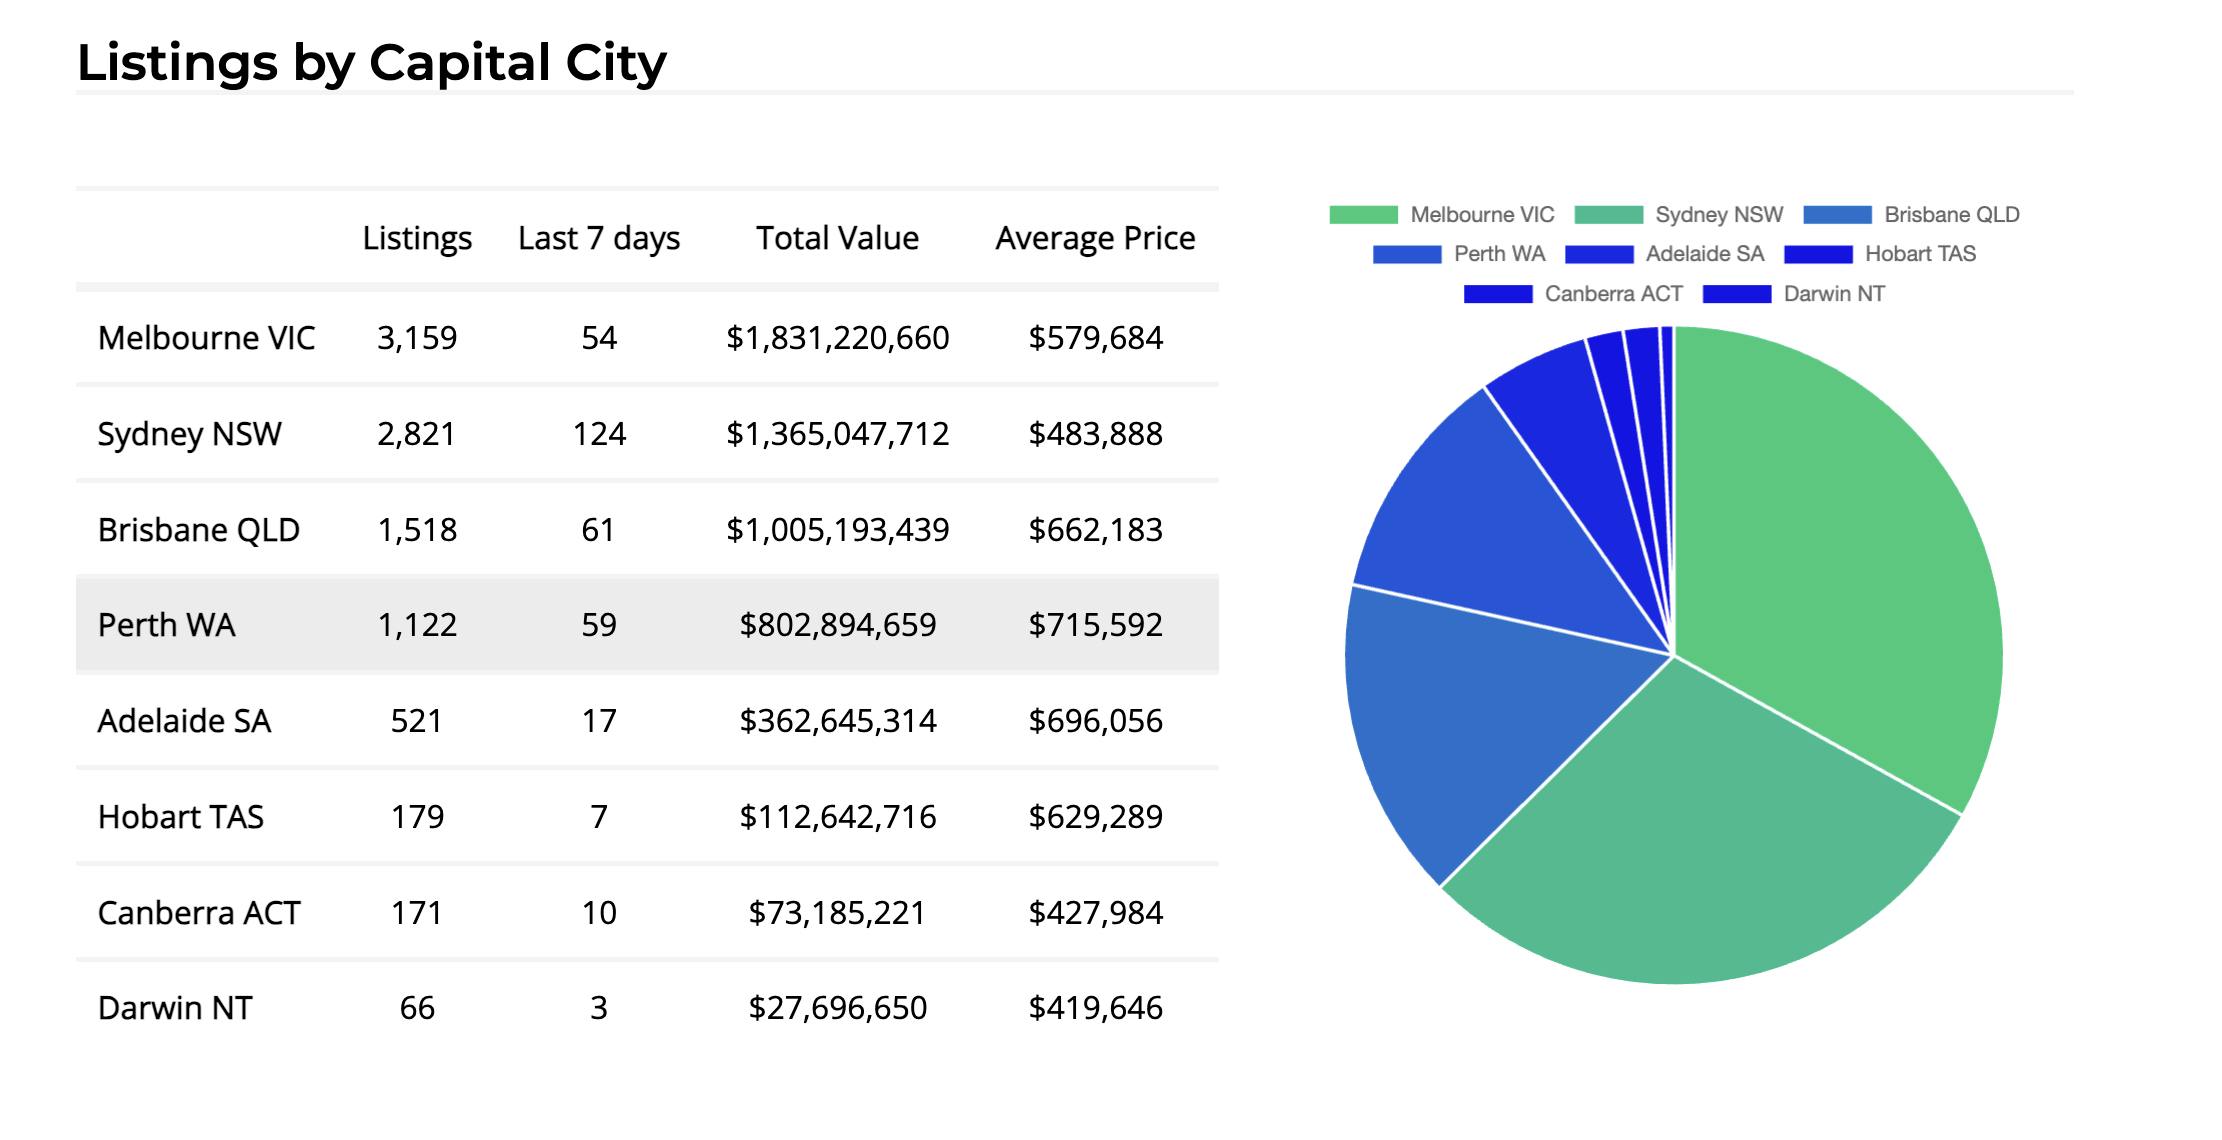
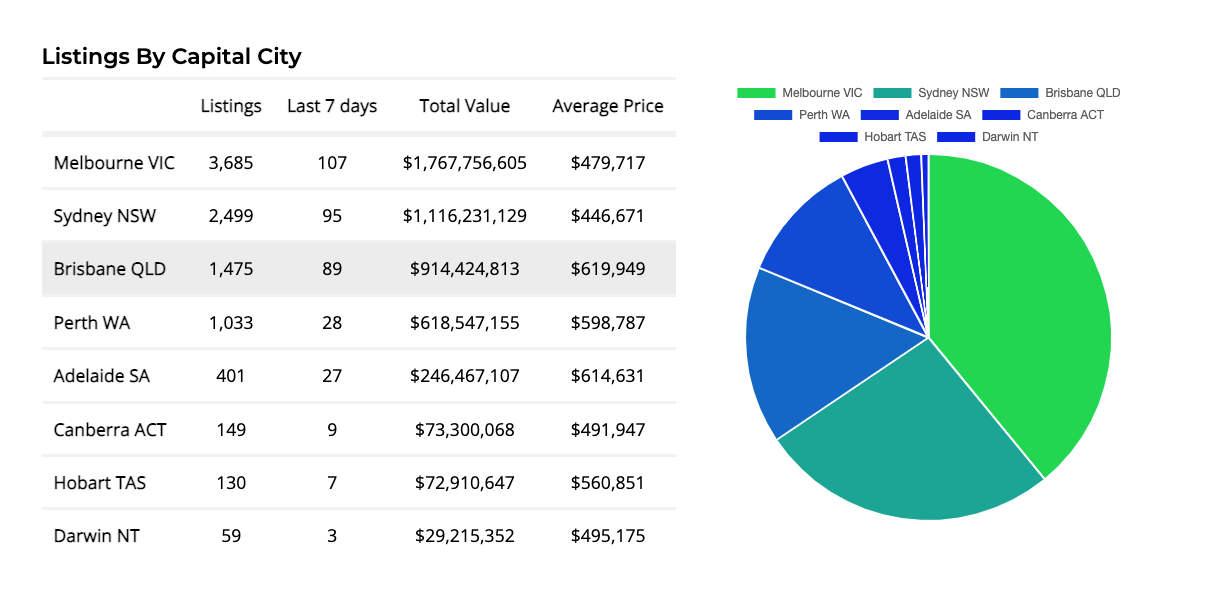
When we look at the number of listings across major cities, Melbourne consistently leads the pack, though the volume has decreased slightly from 3,685 in 2022 to 3,159 in 2024. This reduction might indicate a tightening market, where fewer businesses are being listed, potentially due to increased confidence in holding onto existing businesses.
Victoria is credited as having 25% of the Australian economy, so people are drawn to the state, in particular Melbourne for its climate and stable business economy. Melbourne International Airport is one of Australia’s busiest airports with over 30 million visitors a year, boarding more than 650 international flights every week, so it has a constant flow of tourists and business people.
Sydney, on the other hand, has experienced a rise in listings, growing from 2,499 in 2022 to 2,821 in 2024. This increase could reflect a more dynamic market in Sydney, where businesses are either changing hands more frequently or new opportunities are emerging.
Other cities like Brisbane and Perth have also seen slight increases in their listings. Brisbane's listings went up from 1,475 in 2022 to 1,518 in 2024, and Perth from 1,033 to 1,122. These changes suggest a steady interest in business opportunities in these cities. Meanwhile, cities like Adelaide, Canberra, Hobart, and Darwin have maintained relatively stable numbers, indicating more localized market stability.

August 2024 - Statistics

November 2022 - Statistics
2. Total Market Value: Capital Growth in Major Cities
Melbourne remains the leader in total market value, with its market worth increasing from $1.77 billion in 2022 to $1.83 billion in 2024. This growth underscores Melbourne’s position as a prime location for business investment, where high-value opportunities continue to emerge.
Sydney’s market value also rose significantly, from $1.12 billion in 2022 to $1.37 billion in 2024. This increase reflects Sydney's growing appeal as a business hub, with investors potentially seeking to capitalize on the city's robust economic environment.
Brisbane and Perth have also seen notable increases in their market values, with Brisbane’s market reaching over $1 billion in 2024, up from $914 million in 2022, and Perth's market rising to $802 million from $618 million. These figures highlight the attractiveness of these cities for business investments, particularly in sectors that thrive in regional and coastal environments.
3. Average Listing Prices: Melbourne and Perth Lead the Charge
A detailed examination of average listing prices across major Australian cities reveals a significant trend of rising business prices, with Perth and Brisbane leading in terms of the highest average prices per city.
Perth's average listing price surged from $598,787 in 2022 to $715,592 in 2023, marking a 19.51% increase, and positioning it as the highest average-priced business market in Australia. Brisbane follows with its average price increasing from $619,949 to $662,183.
In terms of percentage growth, Perth and Melbourne are at the forefront. Melbourne saw its average listing price rise from $479,717 to $579,684, marking a substantial 20.84% increase, the highest percentage growth among the major cities. This upward trend in Perth and Melbourne indicates growing confidence in the profitability and long-term potential of businesses in these cities.
Perth's impressive growth is underpinned by Western Australia's robust economic performance, with the state’s economy expanding at twice the national rate in 2023. A 4.7% increase in State Final Demand, compared to the national average of 2.3%, highlights WA’s strong business investment, household consumption, and government spending. Remarkably, WA has maintained consistent economic growth every quarter since June 2020, showcasing its resilience and strong economic fundamentals.
In terms of percentage growth, Melbourne and Perth lead the way:
Increase:
- Melbourne VIC: 20.84% increase, from $479,717 to $579,684.
- Perth WA: 19.51% increase, from $598,787 to $715,592.
- Adelaide SA: 13.25% increase, from $614,631 to $696,056.
- Hobart TAS: 12.20% increase, from $560,851 to $629,289.
- Sydney NSW: 8.33% increase, from $446,671 to $483,888.
- Brisbane QLD: 6.81% increase, from $619,949 to $662,183.
Decrease:
- Canberra ACT: 13.00% decrease, from $491,947 to $427,984.
- Darwin NT: 15.25% decrease, from $495,175 to $419,646.
These figures illustrate that while Perth and Melbourne are leading in growth, other cities like Brisbane and Sydney also continue to show steady increases, reinforcing their positions as attractive markets for business investment.
4. New Listings: A Dynamic Shift in the Market
The number of new listings in the last 7 days paints a dynamic picture of the market. Sydney leads with a significant increase in new listings, jumping from 95 in 2022 to 124 in 2024. This surge may indicate a highly active market where opportunities are continuously emerging.
Conversely, Melbourne and Perth saw declines in new listings over the same period, which might suggest a more cautious market or a saturation of available businesses. Other cities, like Brisbane, Adelaide, and Hobart, have maintained stable or slightly increased numbers, indicating steady market activity.
So What Does This Mean for Business Sales?
The business listings market across Australian capital cities shows both growth and consolidation trends. Melbourne and Sydney continue to dominate in terms of total market value and listings volume, with rising average prices reflecting increased confidence in these markets. Meanwhile, Brisbane and Perth are gaining traction, offering substantial growth in both total market value and average prices.
For potential buyers and investors, these trends highlight the importance of understanding local market dynamics. Whether you’re looking to invest in a bustling metropolitan area or explore opportunities in emerging regions, staying informed about these market shifts will be key to making successful investment decisions in 2024 and beyond.
* Please note that the statistics and data presented in this article are based on user-submitted information. While efforts have been made to ensure accuracy, the figures may not fully reflect official or comprehensive market conditions. Readers are encouraged to verify the information independently and consider potential discrepancies when making decisions based on this data.
Tags: buying a business buyer trends capital cities
About the author

Vanessa Lovie
CEO Bsale Australia
Vanessa is the current manager and CEO of Bsale Australia. Over the past 11 years as a business owner, she understands what it takes to grow a ...


