Australian Business Sales Insights – September Quarter 2026

Australian Business Sales Insights – September 2026
Key findings, July–September 2026
Source: Bsale.com.au, September 2026 quarter. General guide only. Prices may include WIWO, plus SAV or freehold property.
Buyer interest in Australian businesses for sale on Bsale has reached its strongest level in more than a year, with enquiries continuing to rise in the September 2026 quarter.
The first quarter of the new financial year saw buyer enquiries increase for the third consecutive quarter, more businesses enter the market, and recorded sales remain steady.
Buyer demand was the standout on Bsale.
Enquiries rose approximately 12% compared with the June quarter and 28% compared with the same period last year. The number of individual buyers making enquiries also increased by around 23% year on year.

Graph: Index = 100. Bsale enquiries vs listings, September 2025 – September 2026.
Growth was strongest in Queensland and South Australia, and buyers showed a clear preference for businesses that do not need a full-time owner, including remote, automated and under-management operations.
The number of businesses marked as sold rose 3.5% on a year earlier and 6.5% on the June quarter, with hospitality businesses, particularly cafes, making up a larger share than in the June quarter. Victoria accounted for one in three businesses marked as sold.
The number of active businesses for sale on Bsale is roughly 13,600.
Buyers are doing more homework.
Buyers are more numerous and more active, and they are asking for financials, raising finance and requesting confidentiality agreements more often than at any point in the past year. Sales activity has been strongest among more accessible, owner-operated businesses.
Note. The figures presented in this report should be interpreted with caution and used as a general guide to market trends only. The data has inherent limitations, which are outlined in the 'About This Data' section at the end of this article. This information should not be relied upon when making legal, financial or investment decisions. Anyone considering buying or selling a business should conduct their own due diligence and obtain professional advice.

1. Where Are Buyers Enquiring?
Buyer enquiry on Bsale rose for the third consecutive quarter.
August was the busiest month for enquiries in more than a year. Enquiries in the September quarter were about 12% higher than in the June quarter and 28% higher than in the September quarter of 2025.
Traffic to the site rose too, with visits to Bsale from Australian users up almost 30% on a year earlier, page views up 24% and engaged visits up about 19%.

Graph: Monthly Enquiries based on an index July 25 - Sep 26.
New South Wales and Western Australia attracted the most buyer enquiries on Bsale in the September quarter, together accounting for almost six in ten.
NSW and WA attract the most buyer enquiries
New South Wales and Western Australia attracted the most buyer enquiries on Bsale, at about 30% and 28% of the total, followed by Queensland (21%) and Victoria (14%). Western Australia accounts for only about 9% of businesses for sale, so it draws more than three times as many enquiries per business for sale as New South Wales, making it the most intensely contested market on Bsale.
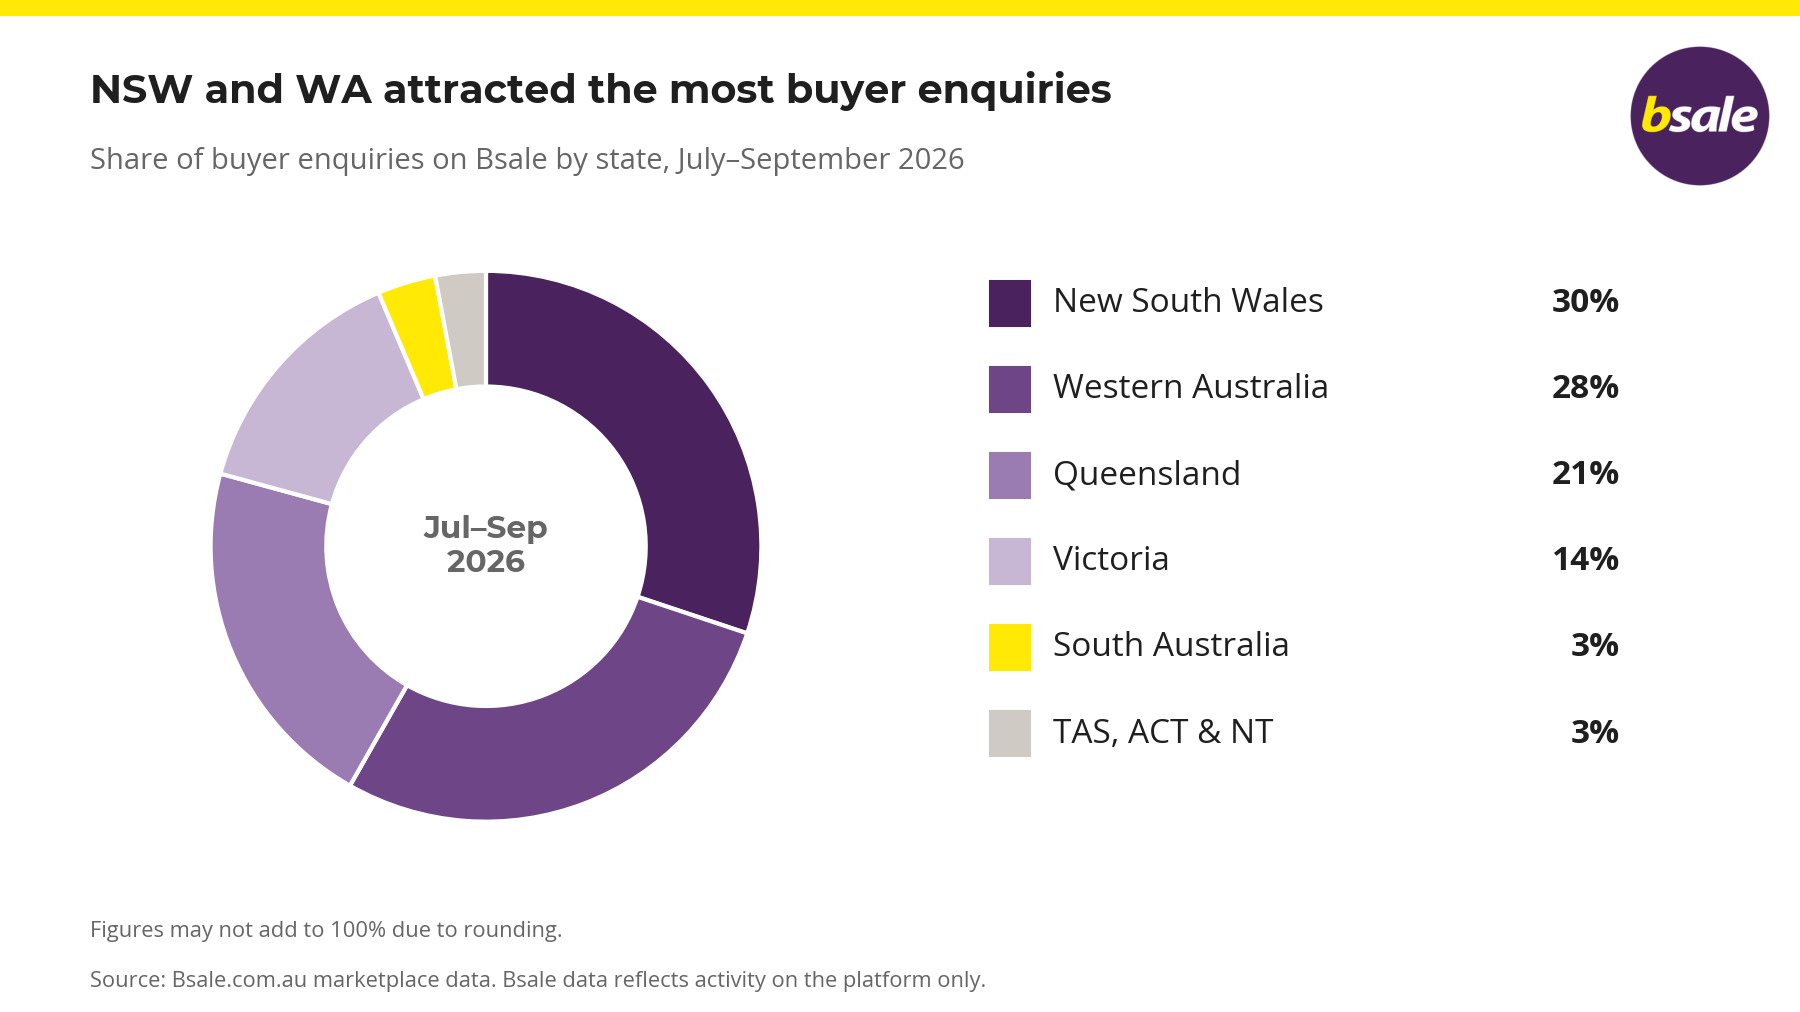
Graph: NSW, WA and QLD most enquiries - Sept 2026
Measured against the size of each market, Western Australia is interesting as it accounts for only 9% of listings but attracts 28% of enquiries, roughly three times its share of the market.
Queensland and South Australia led the growth
Some of the strongest growth came from Queensland and South Australia, where enquiries rose about 47% on a year earlier. New South Wales (up 43%) and Victoria (up 35%) also grew strongly, while Western Australia held steady. Queensland also had the strongest momentum over the quarter, with enquiries up about 38% on the June quarter.

Graph: Enquiries by State 2026 vs 2025.
At a local level, enquiry was strongest around Perth, Sydney, Brisbane, Melbourne and Adelaide, with strong interest in Joondalup, Mandurah, Penrith, Newcastle, Geelong and the Gold Coast.
The industries buyers are targeting
Food Hospitality remained the largest of Bsale's 14 industries, attracting about 28% of enquiries, followed by Services (21%) and Retail (16%).

Graph: Share of Buyer Enquiries Sept 2026 Bsale
The fastest growth came from elsewhere.
Work From Home enquiries more than doubled on a year earlier (up 113%), while Services (up 62%), Manufacturing (up 59%), Professional (up 58%), Automotive (up 51%) and Beauty and Health (up 48%) all grew well ahead of the market.
Food Hospitality (up 5%) and Retail (up 6%) grew more slowly, and Franchise and Accommodation & Tourism were the only industries to record fewer enquiries than a year earlier.
Over the quarter, Work From Home (up 51%) and Professional (up 47%) showed the strongest momentum, while Franchise enquiries fell 14% on the June quarter, the sharpest fall of any industry.

Graph: Enquiries increase by category. Sept 2026
Rising and falling categories
Some of the biggest increases came from service and lifestyle categories.
Enquiries for Working from Home Businesses nearly tripled on a year earlier (up 190%), while Health Spa (up 164%), Printing Service (up 139%), Juice Bar (up 135%) and Entertainment (up 131%) businesses all more than doubled.
Security (up 120%), Accounting (up 116%) and Hire Services (up 108%) also more than doubled, while enquiries across the Professional industry as a whole rose 58%. Cafes remained the most-enquired category, with growth of 11%.
Hospitality, franchise and some retail categories were among the weakest. Enquiries for franchised food outlets fell 39% on a year earlier, newsagencies 30%, pubs 12% and restaurants 8%, while franchise opportunities (down 4%), supermarkets (down 4%) and takeaway businesses (down 3%) also eased.

Image: Enquiry Growth and Falling Buyer Demand Categories Sept 2026.
Increase in Buyers Wanting Businesses That Run Without Them
The clearest theme in the enquiry data is demand for businesses that do not need a full-time owner.
Listings described as remote or home-based attracted more than twice the average number of enquiries per listing, and automated or self-serve businesses such as laundromats, vending and car washes attracted almost twice the average.
Businesses advertised as under management drew around 30% more enquiries than the average listing, a sharp turnaround from a year earlier, when they drew about 20% fewer.

Graph: Listings related to remote, home-based, automated increase in enquiries. Sep 2025 vs Sep 2026.
The most-enquired listings of the quarter fit that pattern, led by near-new laundromats, a remote bookkeeping fee base, a wellness studio, a cafe under management, an automated e-commerce business and an AI-based online business. Liquor stores, a fuel station, an allied health clinic and a self-serve car wash also ranked among the most popular.
Buyers Are Asking More Information Up Front
Buyers are asking for numbers sooner than before.
Among buyers who wrote a message, almost one in four (23%) asked for the business's financials or information memorandum, up from about one in six a year earlier.
Nearly one in five (18%) asked about finance or vendor finance, up from 13%, and one in ten mentioned a confidentiality agreement, up from 6%.
All three were at their highest level in the past five quarters.

Graph: Buyers asking more information up front

2. What's Selling July–September 2026
A total of 444 businesses were marked as sold on Bsale during the September quarter, up about 3.5% on a year earlier.
Their average advertised asking price was $497,740, about 5% lower than a year earlier. These are the asking prices displayed when listings were marked as sold, not confirmed sale prices.
What was marked sold
Food and hospitality remained the largest sector, accounting for about three in ten businesses marked as sold, with 137 in the quarter. That was up 52% on the June quarter but 29% fewer than a year earlier. Cafes led with 76, more than double the 33 recorded in the June quarter, followed by restaurants (48), liquor stores (14), bakeries (11), supermarkets (9) and catering businesses (8).

Graph: Most listings marked as sold by category
Much of the fall on a year earlier came from takeaway businesses, where an unusually high 75 were marked as sold in the September 2025 quarter, compared with 5 this quarter. Excluding takeaway, food and hospitality businesses marked as sold were up on a year earlier. The average advertised asking price of hospitality businesses marked as sold was $304,437.
Growth on last year came from service-based, professional and industrial businesses: professional services rose from 22 to 39, manufacturing from 31 to 41, services from 54 to 70, and education and training from 13 to 30. Retail fell from 65 to 50, and accommodation and tourism from 19 to 12. Medical businesses were among the strongest categories, rising from 8 to 22, while hardware stores and liquor stores recorded fewer than a year earlier.
Higher-value businesses were also marked as sold. Engineering manufacturers marked as sold averaged $1.58 million and building and construction businesses $1.16 million, while supermarkets ($759,322) and medical businesses ($681,500) also sat well above the $497,740 average for all businesses marked as sold. These are advertised asking prices, which may be WIWO, plus SAV or subject to other conditions, so they are not final sale prices.
|
Category |
Marked as sold, Sep 2025 quarter |
Marked as sold, Sep 2026 quarter |
Avg asking price, sold listings |
|---|---|---|---|
|
Cafe |
93 |
76 |
$263,900 |
|
Restaurant |
66 |
48 |
$333,854 |
|
Franchise Business Opportunities |
30 |
32 |
$339,372 |
|
Medical |
8 |
22 |
$681,500 |
|
Educational |
10 |
21 |
$499,524 |
|
Gym |
17 |
17 |
$316,353 |
|
Engineering Manufacturer |
9 |
16 |
$1,583,375 |
|
Mechanics |
13 |
15 |
$556,286 |
|
Hardware |
23 |
15 |
$386,767 |
|
Building and Construction |
17 |
14 |
$1,157,143 |
|
Alcohol Liquor Shop |
21 |
14 |
$407,821 |
|
Supermarket |
14 |
9 |
$759,322 |
|
|
Where Business Sales Occured
Capital cities drove the rise.
Melbourne recorded 125 businesses marked as sold, up from 78 a year earlier, Sydney 70 (up from 44) and Perth 59 (up from 38), while Brisbane fell from 53 to 42.
Victoria accounted for one in three businesses marked as sold nationally, and Melbourne's sold listings carried the lowest average asking price of the major capitals at $359,631, reflecting strong turnover among cafes, restaurants and smaller service businesses.
Western Australia was up 33%, and its sold listings carried the highest average asking price of the larger states at $663,749. New South Wales and Queensland recorded fewer, with the falls concentrated in regional markets such as Newcastle & Hunter Valley and the Mid North Coast.

Graph: Share of businesses marked sold by state
Among the smaller states, South Australia recorded a small rise in businesses marked as sold, from 22 to 24, with Adelaide accounting for most of them. Tasmania recorded fewer than a year earlier, while the Northern Territory and the ACT recorded only a handful each, so their movements are best treated as indicative.
Not every completed sale is recorded as sold. Brokers often withdraw listings to maintain confidentiality, and automated broker feeds can mark several listings as sold at once, so sold trends are best read as an indicator of activity. With a median of 202 days between a business being listed and marked as sold, this quarter's stronger demand may take several months to flow through.
| State | Businesses marked sold | Share of national sales | Avg asking price, sold listings |
|---|---|---|---|
| Victoria | 148 | 33% | $439,979 |
| New South Wales | 109 | 25% | $514,829 |
| Queensland | 84 | 19% | $469,208 |
| Western Australia | 65 | 15% | $663,749 |
| South Australia | 24 | 5% | $371,518 |
| Tasmania | 8 | 2% | $348,175 |
| Northern Territory | 4 | 1% | $1,183,875 |
| Australian Capital Territory | 2 | under 1% | $393,000 |
In the smaller markets, only a handful of businesses were marked as sold, so a single sale can move the average sharply. The Northern Territory’s average of $1.18 million, for example, is based on just four sales and should be read as indicative only. All prices shown are advertised asking prices at the time listings were marked as sold, not confirmed sale prices.
Outside the capitals, the Gold Coast (14), Sunshine Coast (12), Mornington Peninsula (11) and Wollongong & Illawarra (10) recorded the most sales. The smaller states and territories recorded only a handful of sales each, so their averages should be read as indicative only.
Not every completed transaction is recorded as sold. Brokers often withdraw or delete listings to maintain confidentiality, so sold figures on Bsale are best read as an indicator of market activity rather than a complete count.

3. Current Businesses For Sale Market
There are currently around 13,600 listings on Bsale, fewer than in the June quarter, largely because a data cleanup removed out-of-date listings. Listings change constantly, with more than 1,000 updated each week, so the figures in this section are a snapshot of listings live on 30 September 2026.
Listing numbers are not a count of individual businesses. As no address is required, the same business can be listed more than once, and a single franchise or business opportunity can appear across many suburbs and states. Listing totals are best read as a measure of activity on Bsale.
The national average asking price at 30 September 2026 was $740,955, up 6.4% on 30 June 2026 and 11.6% on a year earlier. Part of this increase reflects improved data quality, as a number of listings had their price and location details updated during the quarter. Asking prices are not verified and may include stock, equipment or freehold property.

Graph: Average asking price of listings and businesses for sale
States
Western Australia recorded the highest average asking price of any state at $903,336, followed by the Northern Territory and Queensland. New South Wales remains the deepest market by listing volume and, at $673,143, among the most accessible of the larger states, while Tasmania was the most affordable at $532,624.

Graph: Average asking price by state
South Australia averaged $773,344, above the larger eastern states, with Adelaide the third-highest-priced capital. Victoria averaged $680,506, combining a deep pool of smaller Melbourne businesses with regional centres such as Geelong, Bendigo and Gippsland, where averages sit above $1 million.
In Queensland, Mackay & Central Queensland lifts the state's upper end, while Brisbane and the Sunshine Coast offer more choice in the mid-range. The Northern Territory and the ACT are small markets, where a handful of higher-value listings can move the average.
| State | Average asking price |
|---|---|
| Western Australia | $903,336 |
| Queensland | $870,843 |
| Northern Territory | $870,256 |
| South Australia | $773,344 |
| Australian Capital Territory | $696,656 |
| Victoria | $680,506 |
| New South Wales | $673,143 |
| Tasmania | $532,624 |
Capital Cities
Perth led the capital cities at $949,871, followed by Brisbane and Adelaide. Sydney and Melbourne averaged just over $610,000, but as the largest markets, with more than four in ten businesses for sale between them, they include many smaller cafes, restaurants and service businesses and offer buyers the widest choice.
Perth's lead is consistent with Western Australia's mix of industrial, transport and resource-linked businesses. Hobart averaged $618,335, while Canberra ($696,656) and Darwin ($610,823) are smaller capital city markets, where averages can shift noticeably with just a few listings.
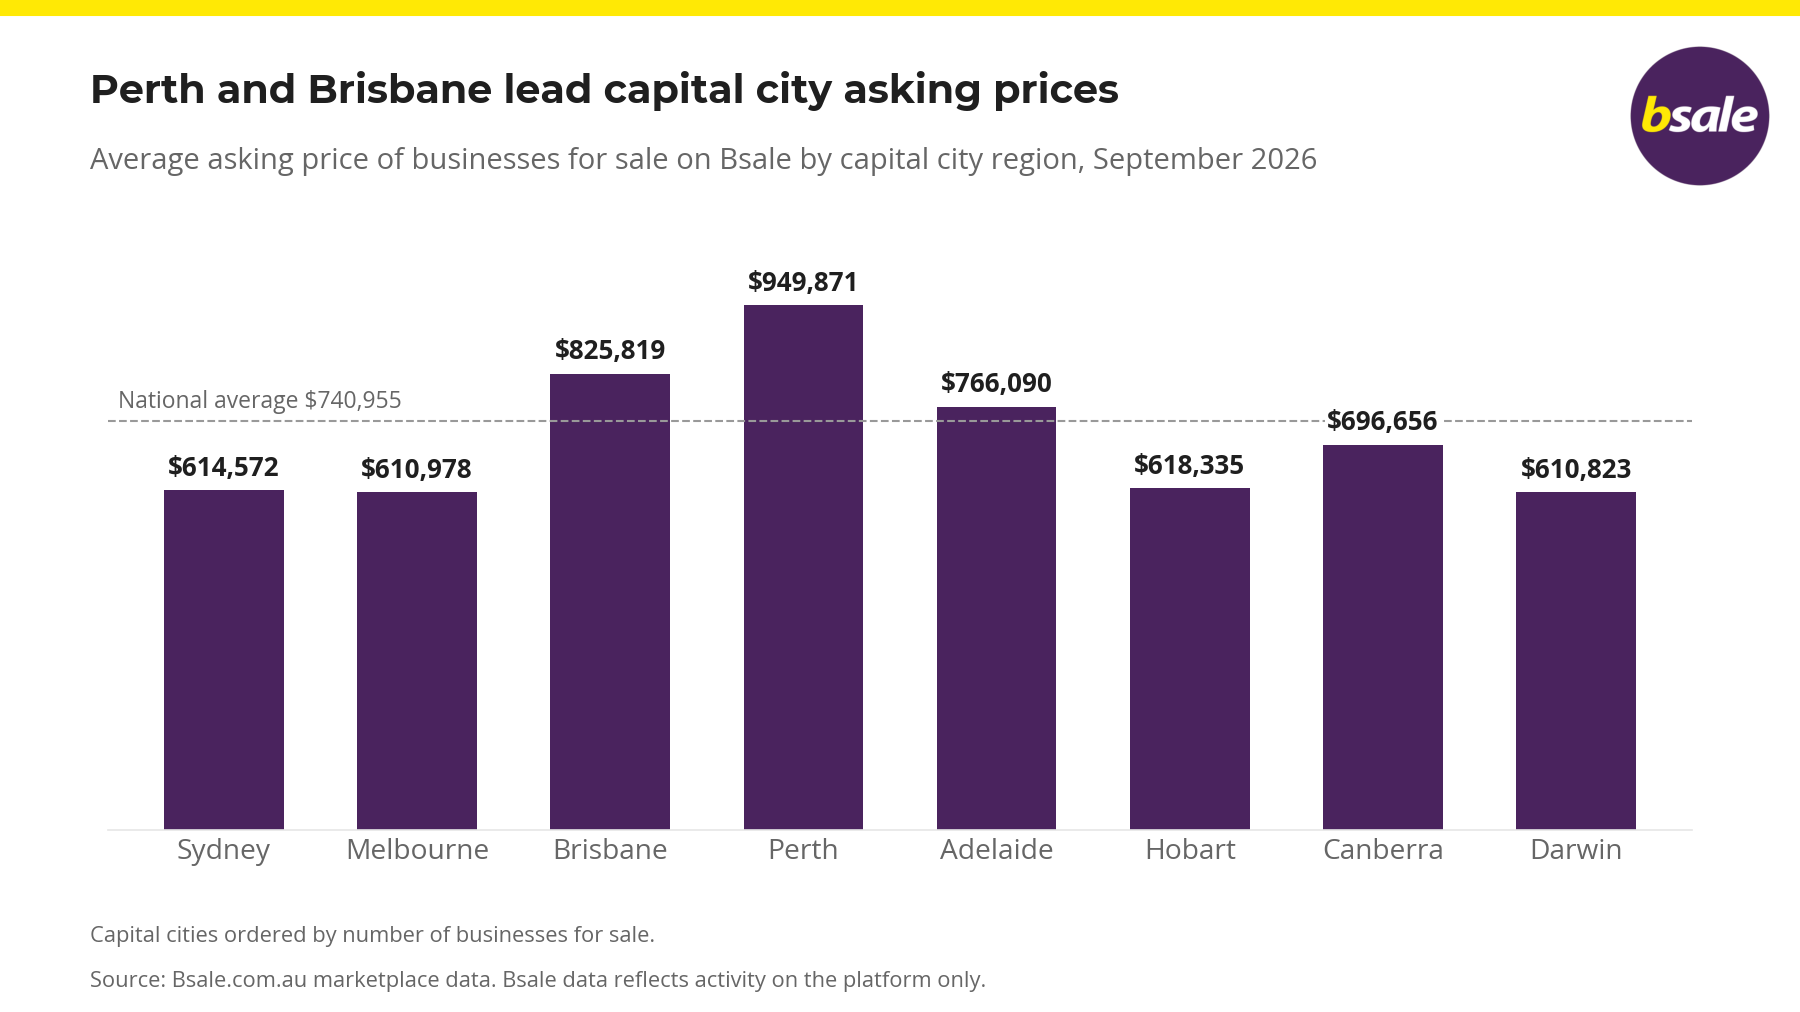
Graph: Average asking price by capital city. Bsale. Sept 2026.
Sydney and Melbourne recorded lower averages, at $614,572 and $610,978, but they are by far the largest capital city markets on Bsale, together accounting for more than four in ten of all businesses for sale nationally. Their size means they include a large number of smaller cafes, restaurants, retail and service businesses alongside larger operations, which keeps their averages below the national figure while giving buyers the widest choice of any market.
| Capital City | Average asking price |
|---|---|
| Perth | $949,871 |
| Brisbane | $825,819 |
| Adelaide | $766,090 |
| Canberra | $696,656 |
| Hobart | $618,335 |
| Sydney | $614,572 |
| Melbourne | $610,978 |
| Darwin | $610,823 |
Regional Markets
Regional markets again recorded the highest average asking prices. Mackay & Central Queensland led at $1.86 million across more than 150 listings, driven by mining services, transport and industrial businesses. Wagga Wagga & Riverina ($1.48 million), Geelong & South West Victoria ($1.16 million) and Bendigo & Goldfields ($1.06 million) were the other large markets in the top 10.

Graph: Asking prices per region Bsale Sept 2026
Several smaller markets, including Broome & Kimberley, Alice Springs and Broken Hill & Western NSW, also averaged above $1.5 million, though with fewer than 25 listings each, one high-value business can lift the average.
Regional Victoria is well represented near the top. Gippsland ($1.05 million) and Shepparton & Hume ($1.02 million) sit close behind Geelong and Bendigo, each across more than 100 listings, making regional Victoria one of the deepest pools of established, higher-value businesses on Bsale.
The larger coastal and regional markets sit in the middle of the market and offer the widest choice, including the Mid North Coast NSW ($908,610), Newcastle & Hunter Valley ($789,871) and the Sunshine Coast ($779,742). The Gold Coast, one of the largest regional markets on Bsale with more than 300 listings, averaged $558,720, making it one of the more accessible coastal markets for buyers.
At the affordable end, the Blue Mountains, Launceston & Northern Tasmania and Bunbury & South West WA recorded the lowest averages, with the Gold Coast, Mornington Peninsula and Central Coast also among the more accessible markets.
Higher regional averages may partly reflect what the asking price includes, such as plant, machinery, vehicles, stock or freehold property, so buyers should check what the price covers.

Graph: Most affordable regions on Bsale by asking price.
Industries
Food and hospitality businesses make up about 30% of listings, services around 19% and retail 12%.
The highest prices sit elsewhere. By industry, manufacturing businesses averaged $1.52 million, automotive $1.29 million and professional businesses $1.24 million, compared with $441,742 for food and hospitality.
At the category level, engineering and manufacturing remained the highest-priced category at $2.02 million, followed by building and construction and medical businesses, while cafes, franchise opportunities and beauty salons remain the most accessible entry points.
| Category | Average asking price |
|---|---|
| Engineering Manufacturer | $2,015,537 |
| Building and Construction | $1,522,497 |
| Medical | $1,088,047 |
| Mechanics | $823,430 |
| Accessories and Parts | $759,505 |
| Hardware | $667,821 |
| Alcohol Liquor Shop | $662,398 |
| Supermarket | $638,536 |
| Training | $565,253 |
| Mobile Services | $516,906 |
| Cleaning | $474,476 |
| Restaurant | $464,508 |
| Gym | $463,038 |
| Lawn Mowing | $445,726 |
| Educational | $437,690 |
| Cafe | $366,258 |
| Franchise Opportunities | $340,061 |
| Beauty Salon | $233,409 |
Outlook for the December Quarter of 2026
The December quarter is typically a busy period for completions on Bsale, as buyers and sellers work to finalise deals before the Christmas and New Year break, and we expect the number of businesses marked as sold to increase.
The market enters that period with buyer enquiry higher than at any point in the past year and more buyers asking about financials, finance and confidentiality agreements, which are typically part of due diligence. How much of that interest converts will depend on how many sellers can meet buyers' expectations on price, financial records and operating structure.
What the September 2026 Trends Tell Us
The September quarter trends on Bsale point to more buyers, steady growth in listings and a gradual rise in businesses marked as sold. For sellers, businesses that are easy to step into, well documented and realistically priced are drawing the strongest interest, while hospitality and franchise sellers face a more crowded field.
For buyers, choice remains wide, but competition is rising, particularly for low-involvement businesses and in Western Australia. Buyers who are prepared with finance and clear criteria will be better placed to act.
For sellers preparing to list, the trends point to three practical steps. You need to have up to date financials and an information memorandum ready before going to market, document how the business runs day to day so a new owner can step in, and price realistically against comparable listings.
For buyers, rising interest in low-involvement and service businesses means being ready to act on the right opportunity, with finance arranged and advisers lined up for due diligence.
About This Data
This report is based on listing information entered by brokers and business owners on Bsale. It should be treated as a general guide to trends only, as the data has inherent limitations:
- Asking prices may include stock, plant and equipment, or freehold property. Bsale does not verify the data, or analyse or adjust for what each price includes.
- Prices for businesses marked as sold are the advertised asking prices, not final sale prices, which are rarely disclosed by sellers.
- As a business address is not required when listing, the same business may be advertised more than once, for example by different brokers, and franchise and business opportunities may be advertised in many locations.
- Not all data is provided, updated or entered accurately. Listings may be withdrawn or changed, stay active after a sale, or be marked as sold without full details.
- Listing figures are a snapshot taken on the last day of each quarter.
- The data reflects activity on Bsale only, not all business sales in Australia. Website traffic insights are from Google Analytics.
This information is not professional, legal, financial or investment advice and should not be relied on when making financial decisions, such as starting, buying or selling a business. Readers should conduct their own research and obtain independent professional advice.
Tags: market insights quarterly report business brokers
About the author
Vanessa Lovie-Yousaf
CEO Bsale Australia
Vanessa Lovie-Yousaf is the CEO and manager of Bsale.com.au, one of Australia’s most trusted business for sale marketplaces since 2000. With 15 ...


