June 2026 Bsale Australian Business Sales Market Report - Q2
June 2026 Australia Business Sales Market Report – Q2 Bsale
Australia’s business for sale market is not short of buyer interest, but the June quarter shows buyers are becoming harder to convert.
At 30 June 2026, there were 16,793 businesses advertised for sale on Bsale, up 0.85% from March. Buyer enquiry activity also increased by approximately 13% over the quarter, suggesting demand remains active across the market.
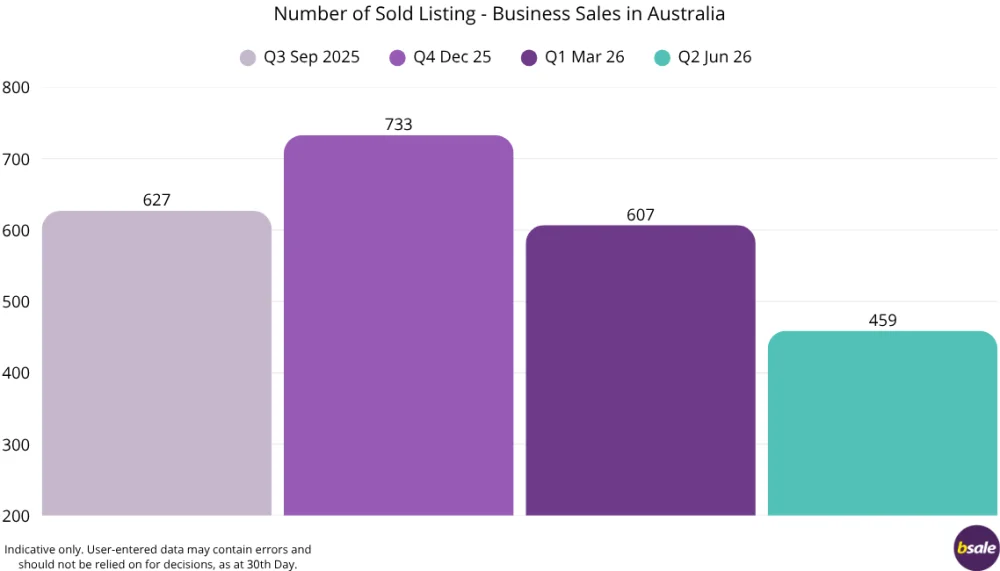
However, the sales information tells a more measured story. A total of 459 businesses were marked as sold during the June quarter, compared with 607 in March, representing a decline of approximately 24.4%. Total advertised market value also eased from $11.21 billion in March to $10.92 billion in June, while the national average asking price softened from $673,124 to $650,462.
The message seems to be that buyers are still in the market, but they are taking longer to commit. More enquiry is not automatically translating into more completed sales. Instead, buyers appear to be comparing more opportunities, scrutinising financials more closely and placing greater pressure on pricing, business quality and operational risk.
The timing of the Federal Budget, announced on Tuesday 12 May 2026, may have added to this more cautious environment. Falling mid-quarter and ahead of 30 June, the Budget coincided with a period when many business owners were already reviewing tax position, performance, succession planning and exit timing. While it is difficult to measure the Budget’s direct impact, uncertainty around tax settings and business costs likely added another layer of consideration for both sellers and buyers.
Rather than pointing to a weak market, the June quarter reflects a more discerning one. Listing volumes increased slighty, buyer enquiry strengthened and businesses continued to transact. But the mix of businesses for sale shifted toward smaller and mid-market opportunities, while fewer high-value listings moved through to completion.
For sellers, this is an important signal. The market remains open, but it is less forgiving. Businesses with clean financials, realistic pricing, recurring revenue, manageable operations and clear performance are better positioned to turn enquiry into serious buyer engagement. For buyers, the quarter suggests more choice and potentially greater negotiating power, particularly where sellers are motivated and pricing expectations have not yet adjusted to market conditions.
This report is based on advertised listing data from Bsale, including asking prices and listing statuses. As the data is user-entered and business sales often require confidentiality, discrepancies may occur. This report should be used as a general guide only and not relied upon for financial decision-making. Always seek professional advice before making any decisions.
National Overview
The June 2026 quarter highlights three key national trends, a softening in average asking, a slight increase in listing volumes, and a slight decline in total advertised market value.
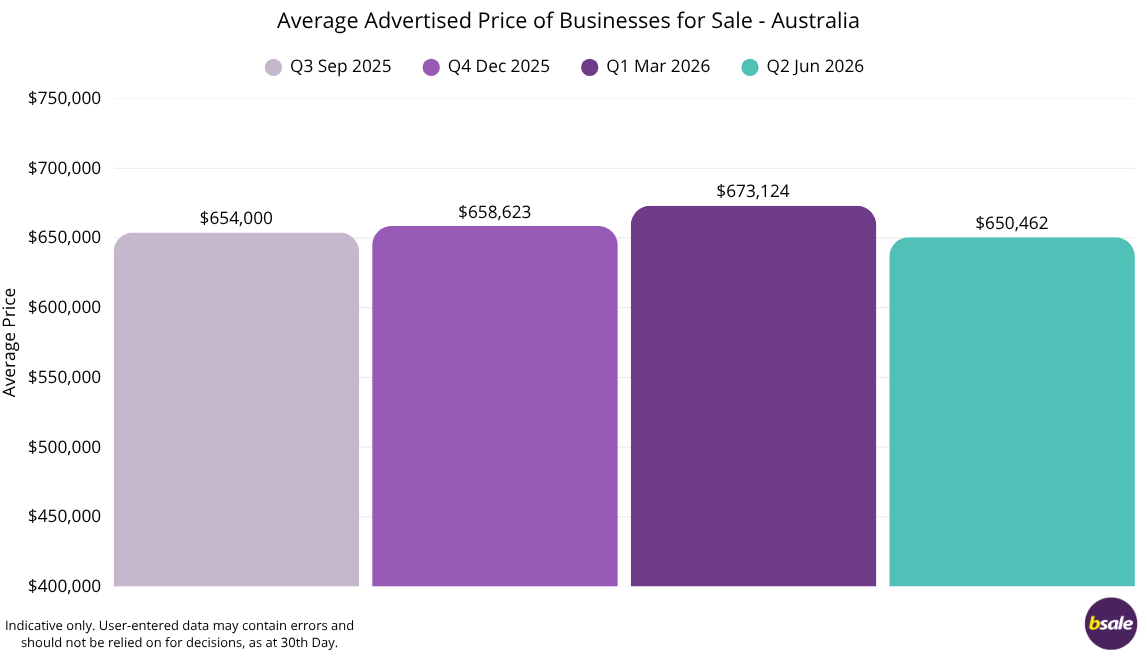
The national average asking price fell slightly from $673,124 in March to $650,462 in June. Though if we look over the past few quarters it is a very stable environment. This easing reflects a shift away from the concentration of high-value listings seen in the previous quarter, rather than a broad decline in business values.

At the same time, listing volumes increased slightly from 16,652 to 16,793 (up 0.85%). This indicates continued willingness among business owners to bring businesses to market, particularly around the end of the financial year when many reassess performance and exit timing.

Total advertised market value declined from $11.2 billion to $10.9 billion (down 2.55%). This aligns with the drop in average asking price and reinforces the view that fewer large, high-value businesses were listed during the quarter.
Taken together, these three indicators show a market that remains active but is becoming more balanced. Growth in listing numbers is being driven by smaller and mid-market businesses, while the absence of large outlier listings has brought average prices and total market value back.
Overall, the June quarter reflects a stable and maturing market environment. But there are signs of larger businesses hesitating on their sales.
State Analysis

New South Wales
New South Wales remained Australia’s largest business for sale market by listing volume, with 5,258 businesses advertised in NSW in June 2026.
Total advertised value reached $3.5 billion the highest of any state. The average asking price was $638,112, down slightly from $644,011 in March, representing a 0.92% decline.
The modest price movement suggests the NSW market remains relatively stable. With the largest number of listings nationally, NSW is less exposed to sharp swings caused by individual high-value listings. Its market continues to be shaped by a broad mix of cafes, service businesses, retail operations, professional services, industrial businesses and regional opportunities.
Victoria
Victoria recorded another stable quarter, with 4,433 businesses listed for sale in VIC and a total advertised market value of $2.7 billion
The average asking price increased slightly from $597,097 in March to $600,175 in June, a rise of 0.52%. Victoria ranked sixth nationally by average asking price.
The result reflects a mature and balanced market. Like NSW, Victoria’s large listing volume helps moderate major swings in average asking price. Melbourne and regional Victorian markets continue to offer a broad mix of hospitality, retail, services, health, trades, manufacturing and franchise opportunities.

Queensland
Queensland remained one of Australia’s largest and highest-value business-for-sale markets, with 3,966 listings in QLD and a total advertised market value of $2.8 billion
The state recorded an average asking price of $711,643, down 1.69% from $723,887 in March. Queensland moved from first to second position nationally by average asking price.
The state continues to perform strongly, particularly across Brisbane, the Sunshine Coast, Mackay and Central QLD, Cairns, and other regional markets supported by tourism, trades, resources, services and population growth.
Western Australia
Western Australia recorded the highest average asking price nationally in June 2026, moving into first position with an average of $722,609.
The state recorded 1,796 listings in WA with a total advertised market value of $1.3 billion. While listings eased from 1,897 in March, the average asking price increased by 2.82%, up from $702,801.
This combination of lower supply and higher average pricing suggests WA continues to be supported by larger, asset-backed and resource-linked businesses. Transport, industrial services, regional operations and businesses connected to mining and essential industries continue to influence the state’s pricing profile.

Tasmania
Tasmania recorded a steady June quarter, with 371 businesses listed for sale in TAS and a total advertised value of $234 million.
The state’s average asking price increased from $621,839 in March to $632,810 in June, a rise of 1.76%. Tasmania ranked fourth nationally by average asking price.
As a smaller market, Tasmania’s average prices can be influenced by a relatively small number of higher-value listings, particularly in tourism, hospitality, accommodation and freehold-related opportunities. The June result suggests continued stability, with modest pricing growth despite a slight fall in listing volume.
Northern Territory
There are 90 listings in NT in June 2026, with a total advertised market value of $56 million.
The average asking price increased from $595,078 in March to $627,774 in June, representing growth of 5.49%. This moved the NT into fifth position nationally by average asking price.
Given the small size of the NT market, quarterly movements should be interpreted carefully. A handful of higher-value listings can materially shift averages. However, the June result suggests renewed strength among larger regional, tourism, service and asset-backed opportunities.
South Australia
South Australia recorded the sharpest average price decline of the quarter, with the average asking price falling from $708,764 in March to $571,369 in June.
This represents a decline of 19.39%, moving South Australia from second to seventh position nationally by average asking price. Listings increased from 654 to 712, while total advertised value fell from approximately $463 million to $406 million
Rather than indicating a broad weakening in the market, the result appears to reflect a shift in listing composition. South Australia’s March quarter was influenced by a stronger concentration of higher-value listings. By June, the increase in listing volume combined with a lower average asking price suggests more smaller and mid-market businesses entered the market.
Australian Capital Territory
The ACT remained Australia’s most affordable state or territory market by average asking price in June 2026, despite recording solid growth.
The ACT had 167 listings with a total advertised market value of $89 million. The average asking price increased from $507,534 in March to $533,908 in June, a rise of 5.20%.
Although the ACT remains a relatively small market, the June result shows steady improvement. Listing volumes also increased slightly, suggesting continued confidence among business owners considering a sale.
Regional Market Insights
Regional Australia continues to play a major role in shaping national business asking prices. The June 2026 quarter shows that many of the country’s highest-priced markets sit outside the capital cities, particularly in regions supported by mining, transport, tourism, agriculture, freehold ownership and asset-heavy industries.
Following the removal of major non-business outliers from the Gold Coast data, the regional rankings now present a more realistic view of business-for-sale activity across Australia.
The Highest-Priced Regional Markets in June 2026
- Broome & Kimberley Region WA - Avg: $1,928,903
- Mackay & Central Queensland Region QLD - Avg: $1,405,444
- Broken Hill & Western NSW Region NSW - $1,325,715
- Coral Coast & Mid West Region WA - $1,308,411
- Wagga Wagga & Riverina Region NSW - $1,247,910
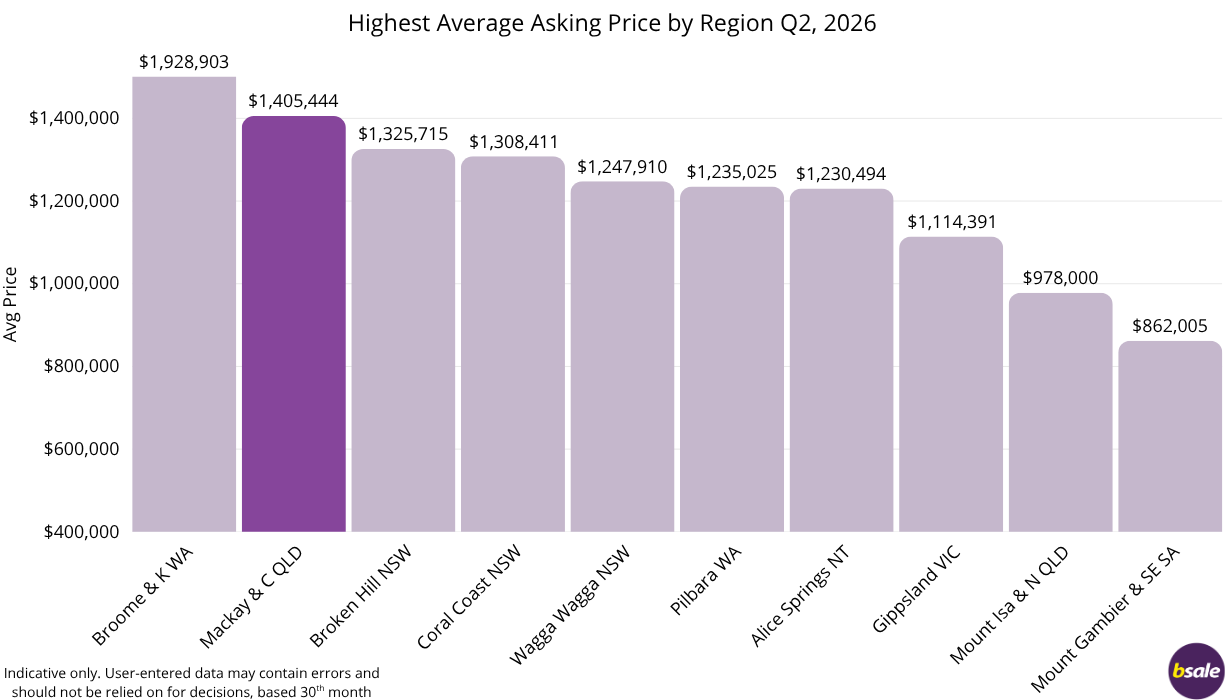
Broome & Kimberley, WA recorded the highest regional average asking price in June 2026 at $1.93 million, supported by a small but high-value listing pool.
Mackay & Central Queensland followed with an average asking price of $1.41 million, reflecting the continued strength of mining, industrial, transport and essential service businesses across the region. We take an indepth look at why Mackay and Central WA is standing out this quarter.
Broken Hill & Western NSW recorded an average asking price of $1.33 million, while Coral Coast & Mid West WA followed closely at $1.31 million, Wagga Wagga & Riverina also entered the upper tier of regional markets, recording an average asking price of $1.25 million across 185 listings.
These results show the continued strength of regional markets where businesses are often larger, asset-backed, freehold-related or connected to essential regional industries.
Strong Second-Tier Regional Markets
Several regional markets recorded average asking prices between approximately $800,000 and $1.1 million, showing strength beyond the traditional mining and resource regions.
Gippsland recorded an average asking price of $1.11 million, up 3.6% from March. Mount Isa & North West Queensland reached $978,000, while Mount Gambier & South East South Australia increased to $862,005.
Shepparton & Hume recorded one of the stronger regional movements, rising 22.91% to an average asking price of $850,832. Mid North Coast NSW, Dubbo & Central West, Tamworth & New England, and Toowoomba & Darling Downs also remained significant regional markets with strong listing volumes and average asking prices above $775,000.
These regions are supported by diversified local economies, agriculture, transport, health services, construction, manufacturing, tourism and growing regional populations.
Lifestyle Regions Offer More Accessible Entry Points
Lifestyle and coastal regions continued to provide a broad range of opportunities for buyers seeking more accessible price points.
The Sunshine Coast recorded an average asking price of $668,161, while Cairns & Far North Queensland recorded $628,723. Bunbury & South West WA reached $623,842, Geelong & South West Victoria recorded $582,574, and Newcastle & Hunter Valley recorded $568,373.
These markets remain popular with buyers seeking a combination of business ownership and lifestyle appeal. They also tend to contain a higher proportion of cafes, restaurants, tourism businesses, retail stores, health and wellness businesses, and service-based operations.

At the lower end of the regional price rankings, Blue Mountains, Mornington Peninsula, Launceston & Northern Tasmania, Barossa Valley and the Gold Coast after outlier adjustment all show more accessible average asking prices. These markets may appeal to first-time buyers, owner-operators and lifestyle purchasers looking for businesses at lower entry points. It is notable that two capital cities also make the list with Darwin and Canberra.
Capital City Analysis
Capital city markets remained relatively stable in June 2026, with Hobart recording the highest average asking price among the capital cities.
Hobart’s average asking price increased to $764,480, up 4.84% from March. As one of the smaller capital city markets, Hobart’s average can be influenced by a limited number of higher-value tourism, accommodation or freehold-related opportunities.
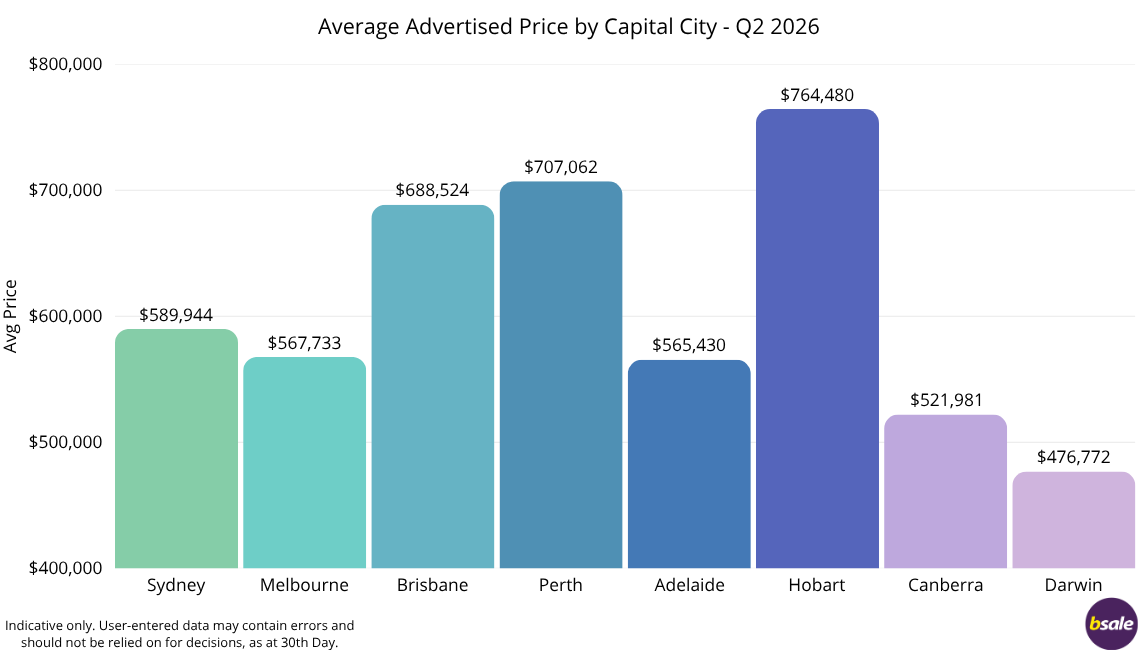
Perth ranked second among the capital cities, with an average asking price of $707,062. While listing volumes eased from March, Perth continued to benefit from WA’s broader economic strength and demand for asset-backed, industrial and resource-linked businesses.
Brisbane recorded an average asking price of $688,524, down 1.46% from March. However, listings increased from 1,847 to 1,959, reinforcing Brisbane’s position as one of Australia’s most active business-for-sale markets.
Sydney remained the largest capital city market by listing volume, with 3,418 businesses advertised in June. Its average asking price increased slightly to $589,944, reflecting steady demand and a broad mix of business types.
Melbourne recorded an average asking price of $567,733, down 2.15% from March. With 3,299 listings, Melbourne remains one of the deepest and most diverse markets nationally.
Adelaide recorded the largest capital city decline, with average asking prices falling from $720,993 in March to $565,430 in June. This mirrors the broader South Australian result and appears largely driven by a change in listing composition after a stronger March quarter.
Canberra and Darwin remained the most affordable capital city markets, with average asking prices of $521,981 and $476,772 respectively. Both markets recorded modest growth, although their smaller listing volumes mean quarterly changes should be interpreted with care.
Overall, the capital city data shows a stable market, with most price movements driven by listing mix rather than major shifts in buyer demand.
Where Buyers Are Enquiring
Buyer enquiry behaviour during the June quarter points to a practical and selective market. Buyers are active, but they are not enquiring randomly. They are gravitating toward businesses with clear earnings potential, simple operations, recurring demand and realistic pricing.
Compared with the March quarter, overall email enquiry activity increased by approximately 13%, indicating that buyer engagement strengthened through the second quarter. Rather than suggesting a speculative market, the data points to buyers actively reviewing opportunities across a broad range of sectors, with a clear preference for businesses that demonstrate cashflow, essential demand, simple operations or low owner involvement.
At a state level, New South Wales and Western Australia attracted the largest share of buyer enquiry activity. New South Wales accounted for approximately 32% of enquiries during the June quarter, increasing from around 28% in the March quarter. Western Australia remained very strong, attracting approximately 30% of enquiries, although this was down slightly from around 33% in Q1. Queensland followed with approximately 17%, while Victoria accounted for around 14%.
This shows that buyer interest remains concentrated in the major business markets, with continued strength in Western Australia. At a suburb level, enquiry activity was strongest around Perth, Sydney, Brisbane and Melbourne, with additional buyer interest spread across key suburban and regional locations including Mandurah, Coffs Harbour, Southport, Maroochydore, Newcastle, Joondalup, Bunbury and Port Macquarie.

Other Industries include business that have been loaded in multiple categories without clear titles, so enquiries arent clearly identified by industry.
From an industry perspective, hospitality, food and beverage remained the largest enquiry category, accounting for approximately 15.7% of Q2 enquiry activity. This was down from around 17.4% in Q1, suggesting hospitality remains highly active but buyer interest has become more selective. Cafes, restaurants, takeaway businesses, bars, bakeries and food service businesses continued to attract enquiries, particularly where listings promoted strong sales, low rent, simple operations, under-management structures or prominent locations.
Manufacturing, wholesale, industrial and trade businesses increased their share of enquiries, rising from approximately 12.8% in Q1 to 13.5% in Q2. This was one of the more positive shifts of the quarter and reflects continued buyer interest in businesses with established customer bases, repeat trade, supplier relationships and practical operating models. Listings involving distribution, importing, engineering, printing, building services, trade supply, equipment and industrial products continued to attract attention.
Retail and essential retail remained steady, accounting for approximately 11.5% of enquiry activity in Q2. Supermarkets, bottle shops, convenience stores, post offices, lotto agencies, general stores and product-based retail businesses continued to appeal to buyers seeking familiar business models and consistent customer demand.
Health, fitness, beauty and care businesses also remained strong, holding approximately 11.1% of enquiry activity. Gyms, Pilates studios, wellness businesses, NDIS-related businesses, allied health, beauty and personal care businesses all continued to feature. This reflects ongoing buyer interest in businesses supported by memberships, appointments, recurring clients or growing consumer demand for health and lifestyle services.
Automotive, fuel and vehicle service businesses accounted for approximately 7.9% of enquiry activity, easing slightly from Q1 but remaining an important buyer category. Service stations, car washes, mechanical workshops, tyre businesses, vehicle hire businesses and automotive service operations continued to attract enquiries, particularly where they were positioned as established, branded or semi-managed opportunities.
One of the clearest buyer themes during the quarter was interest in businesses offering simplicity and low owner involvement. Cleaning, home and property service businesses increased their share of enquiries to approximately 6.1%, while laundry, vending and automated service businesses remained steady at around 2.5%. Fully automated car washes, laundromats, vending businesses, cleaning operations and property services all attracted interest, reflecting buyer demand for practical businesses with clear systems and manageable operating requirements.
Online, technology and digital businesses continued to attract attention, accounting for approximately 5.7% of enquiries. AI businesses, digital agencies, ecommerce stores, software applications and remote service businesses remained a smaller but important part of enquiry activity. These opportunities appeal to buyers looking for scalability, flexibility and lower overheads, although the category remains more niche compared with hospitality, retail and industrial businesses.
Accommodation, tourism and leisure businesses remained stable at approximately 4.8% of enquiry activity. Roadhouses, pubs, motels, accommodation businesses and tourism-related opportunities continued to receive interest, particularly where listings included strong regional positioning or asset-backed appeal.
Franchise and licence opportunities also increased slightly, rising from approximately 1.4% in Q1 to 2.0% in Q2. This suggests some buyers are continuing to look for structured entry points into business ownership, particularly where the model provides brand recognition, systems and support.
Overall, the June quarter reinforces a clear message that buyers are active, but disciplined. The strongest enquiry themes continue to centre on hospitality, essential retail, industrial and trade businesses, health and fitness, automotive services, and low-involvement business models.
What’s Selling April–June 2026
During the June quarter, 459 businesses were marked as sold on Bsale, compared with 607 businesses in the March quarter. This represents a decline of approximately 24.4%, indicating a slower transaction environment following the stronger March result.

The total advertised asking value of businesses marked as sold was approximately $252.5 million. This figure is based on the asking prices displayed on listings at the time they were marked as sold and should not be interpreted as confirmed transaction value. As actual sale prices are often confidential, these figures provide an indication of the value of businesses moving through the market rather than the exact value of completed sales.
The average advertised asking price of sold listings was approximately $551,262, while the median was lower at $272,500. This gap between the average and median suggests that while some higher-value businesses continued to transact, a large proportion of completed sales activity occurred in the smaller and mid-market segment.
Compared with the March quarter, when 607 businesses were marked as sold with a combined advertised value of approximately $361.2 million, the June quarter recorded both fewer sold listings and a lower total advertised sold value. This suggests the market shifted away from the higher-value activity seen earlier in the year, with completed sales more heavily concentrated among smaller, owner-operated and mid-sized businesses.
Despite the lower number of businesses marked as sold, the June quarter still showed activity across a broad range of industries. Hospitality remained one of the busiest sectors by volume, with cafes, restaurants, takeaway businesses, bars, bakeries, accommodation businesses and licensed venues regularly marked as sold across both metropolitan and regional markets.
Professional service businesses also featured throughout the quarter, including accounting practices, bookkeeping firms, managed IT providers, outsourced administration businesses and digital agencies. These types of businesses continue to appeal where they offer established client relationships, repeat revenue and scalable operating models.
Manufacturing, wholesale and industrial businesses remained well represented, with engineering firms, commercial printers, wholesale distributors, timber businesses, construction services and automotive specialists all appearing among sold listings. These businesses tend to attract interest where they have proven trading histories, experienced staff, equipment, supplier relationships and long-term customer bases.
The automotive sector also recorded steady sales activity, including tyre and mechanical workshops, truck specialists, caravan repair businesses, hire car operators and other vehicle service businesses. Health, fitness, lifestyle, childcare, education, retail and franchise opportunities were also represented, showing that completed sales were not limited to one sector or price bracket.
Online and technology-focused businesses continued to appear among sold listings, including software applications, AI-based platforms, online retail businesses and remote service businesses. While still a smaller part of the overall sold market, their presence reflects ongoing interest in scalable, flexible and location-independent business models.
Importantly, businesses with advertised asking prices below $100,000 were marked as sold alongside businesses advertised at well over $1 million. This reinforces that sales activity continued across multiple budget levels, even though the June quarter was more weighted toward smaller and mid-market transactions.
Overall, the June quarter reflects a softer but still active sales environment. Fewer businesses were marked as sold compared with March, and the total advertised value of sold listings declined. However, the breadth of industries represented shows that well-positioned businesses continued to transact, particularly where pricing, financial performance and operating structure aligned with market expectations.
Outlook for Q3 and the Year Ahead
As the market moves into the September quarter and the new financial year, business sale activity is expected to remain active, but selective. EOFY is often a natural decision point for owners, prompting reviews of financial performance, tax position, succession planning and long-term exit timing. This may support a fresh pipeline of businesses coming to market through Q3 and into the second half of 2026.
The outlook, however, remains measured. The 2026–27 Federal Budget tax reform discussions, interest rates, inflation pressure and rising operating costs are likely to keep buyers disciplined. Funding conditions continue to influence acquisition decisions, particularly for larger or highly leveraged transactions, with buyers placing greater emphasis on clear earnings, reliable cashflow and realistic asking prices.
For the business sales market, the proposed budget has had mixed effects. Some owners may bring forward succession planning or exit discussions in order to understand their position before the new rules commence. Others may delay going to market until they have clearer advice on tax, structure and timing. In either case, the new financial year is likely to place greater emphasis on preparation, accurate financial records and professional advice.
Discretionary trusts are another area to watch. From 1 July 2028, the Government proposes to introduce a 30% minimum tax on discretionary trusts, with some exceptions. Rollover relief will be available for three years from 1 July 2027 to assist small businesses and others that wish to restructure out of discretionary trusts into other arrangements, such as a company or fixed trust.
Overall, the outlook for the remainder of 2026 remains positive, but more selective. The market is likely to favour quality businesses that are well documented, realistically priced and able to demonstrate consistent performance.
Note: This report is based on listing information entered by users on Bsale and should be treated as a general guide only. Due to the nature of business sales, not all data is always provided, updated, or entered accurately, and advertised prices may differ from final sale prices. Listings may also be withdrawn, changed, or marked as sold without full details being available, resulting in an inherent margin for error in the data. This information should not be considered professional, financial, or investment advice and should not be relied upon when making business or purchasing decisions. Readers should conduct their own research and obtain independent advice where appropriate.
Tags: market insights quarterly report 2026
About the author

Vanessa Lovie-Yousaf
CEO Bsale Australia
Vanessa Lovie-Yousaf is the CEO and manager of Bsale.com.au, one of Australia’s most trusted business for sale marketplaces since 2000. With 15 ...


